If you have configured the Management Console appropriately (see Configuring the BeanConnect Management Console as a Log4j socket reader ), it receives the logging events output to the socket appender provided on the relevant resource adapter or proxy.
To display the logging events on the Management Console:
Start the relevant proxy (see Starting a proxy ).
Check whether the Automatically Begin to Listen option in the General Diagnostic Info Configuration panel is set. Only if this option is selected does the Management Console wait for logging events at the specified listener port right from the start.
Alternatively, you can also use the Start Listening command in the context menu of the Proxy Container Log4j node beneath the Configuration node.
Click Advanced Features - Diagnosis - Output - Proxy Container Log4j in the navigation tree of the proxy.
The Management Console displays the messages received in the Logging Output panel.
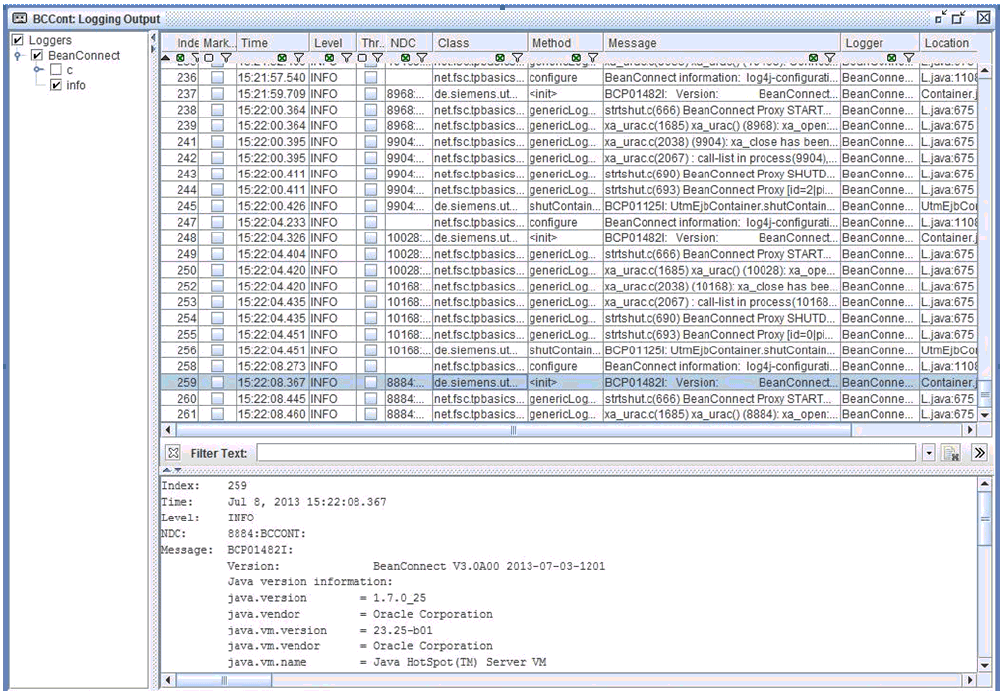
Figure 68: Logging output
The Logging Output panel consists of the following areas:
Logger Tree: Displays all the loggers for which there are messages in the Management Console. Loggers whose paths are shown in red in the structure have at least one message with the logging level WARN.
Logging Event List: Displays those logging events available in the Management Console that match the current settings in the Logging Output panel. Messages that appear in red have at least the logging level WARN.
When you select an event from the event list, it is displayed in detail in the lower part of the event list.
You will find detailed information on the panels and commands of the context menus in the Management Console's online help system.
Changing the layout of the panel
By default, the logger tree is displayed on the left of the panel and the message list on the right. You can change this setting so that the logger tree and message list are each displayed on a separate tab:
Click the Properties button in the Logging Output panel.
The Logging Properties dialog box appears.Select the display mode under Display Mode.
split
The logger tree and logging event list are displayed on the left and right of the panel respectively.tabbed
The logger tree and logging event list are displayed on two separate tabs.
Activating/deactivating the display of the loggers
The event list only displays the events of loggers that are activated in the event list.
To activate or deactivate the display for a logger:
Click the relevant logger node or its check box. This node, all the nodes in the path of the node up to the node logger and all the associated child nodes are activated/deactivated.
Changing the display of messages
Events are displayed in the event list in accordance with the following criteria:
Only messages of the loggers that are activated in the logger tree (see the section described above).
Only messages that are not currently suppressed.
The Clear button in the Logging Output panel consigns to the background all the logging events of the relevant proxy that currently exist in the Management Console. The messages are then no longer included in the output in the panel although they still exist in the Management Console. You can display them again by clicking the Consider All button.
Only those messages whose logging level corresponds at least to the minimum logging level set for the list.
You set the logging level for the message list either by means of the buttons in the Logging Output panel or by means of the Minimum Displayed Logging Level option in the Logging Properties dialog box.
If a Filter Mask is entered in the Logging Properties dialog box, only the messages that contain the filter text in at least one column (a distinction is drawn between uppercase and lowercase).