The following options are available:
Command ftshwm: Displaying local monitoring data.
openFT Monitor: Displaying local or remote monitoring data
You start the openFT Monitor either using the openFT Explorer (Extras menu or the context menu of a partner entry) or using the ftmonitor command.
If you want to view the monitoring data of openFT instances on the other systems, you specify the partner and the transfer admission when you call the openFT Monitor. This is done implicitly in the openFT Explorer if you start the openFT Monitor from the context menu of an entry in the Partner object directory. In order to do this, you must activate the Remote Command Execution and Administration Objects options in the properties of this partner.
Preprocessing: Displaying remote monitoring data
To do this, you define an admission profile by specifying a file name prefix with the keyword *FTMONITOR as a preprocessing command, see section “Displaying monitoring data”
Windows Performance Monitor: Displaying local monitoring data (only on Windows systems), see section “Displaying monitoring data”.
Setting up an admission profile for displaying monitoring data
This example shows how you set up an admission profile for preprocessing on the remote system (1.) and how you can use it to perform output via the openFT Monitor (2.) and linebased output (3.).
Define an admission profile monitor1 on the remote system Partner1 that only permits the output of monitoring data. Assign onlyftmonitor as the transfer admission.
Unix or Windows system:
ftcrep monitor1 onlyftmonitor -ff=tp -fnp="|*FTMONITOR "BS2000 system:
/CREATE-FT-PROFILE NAME=MONITOR1 -
   ,TRANSFER-ADMISSION=ONLYFTMONITOR, -
   ,FILE-NAME=*EXPANSION('|*FTMONITOR ') -
   ,FT-FUNCTION=(*TRANSFER-FILE,*FILE-PROCESSING)
z/OS system:
FTCREPRF NAME=MONITOR1
   .TRANSFER-ADMISSION=ONLYFTMONITOR -
   ,FILE-NAME=*EXPANSION('|*FTMONITOR ') -
   ,FT-FUNCTION=(*TRANSFER-FILE,*FILE-PROCESSING)
The asterisk (*) in *FTMONITOR in the profile monitor1 must be specified. It is furthermore recommended to enter a space after *FTMONITOR in the profile itself, in order that subsequent options are automatically separated from the command.You can specify the transfer admission of this profile in the
ftmonitor command if you wish to view the openFT monitoring data from a remote system.
ftmonitor -po=10 Partner1 onlyftmonitorIn order to call the graphical openFT Monitor from the openFT Explorer, define a partner with this transfer admission in the Partners object directory.
Alternatively, you can use this FTAC profile to get the monitoring data in the form of linebased output and redirect it to a file for further processing using an ft or ncopy command. Note that at this point, only the interval can be set, but no monitoring data can be selected. Output is always in CSV format. The following command allows you to output the current monitoring values of Partner1 at 10-second intervals:
ncopy Partner1!“-po=10“ partner1_data onlyftmonitorThe monitoring data is output to the file partner1_data. The only parameter that you can specify within the quotes is -po=polling interval. If you wish to use the default polling interval of one second, enter a space between the quotes.
Displaying monitoring data via the Windows Performance Monitor (Windows systems)
To do this, first activate the required monitoring values via the Control Panel. Proceed as follows (the description applies to Windows 10):
Start the Windows Control Panel and choose System and Security - Administrative Tools - Performance Monitor to open the Performance Monitor window.
In the navigation bar, click on Monitoring Tools - Performance Monitor and click on the + button.
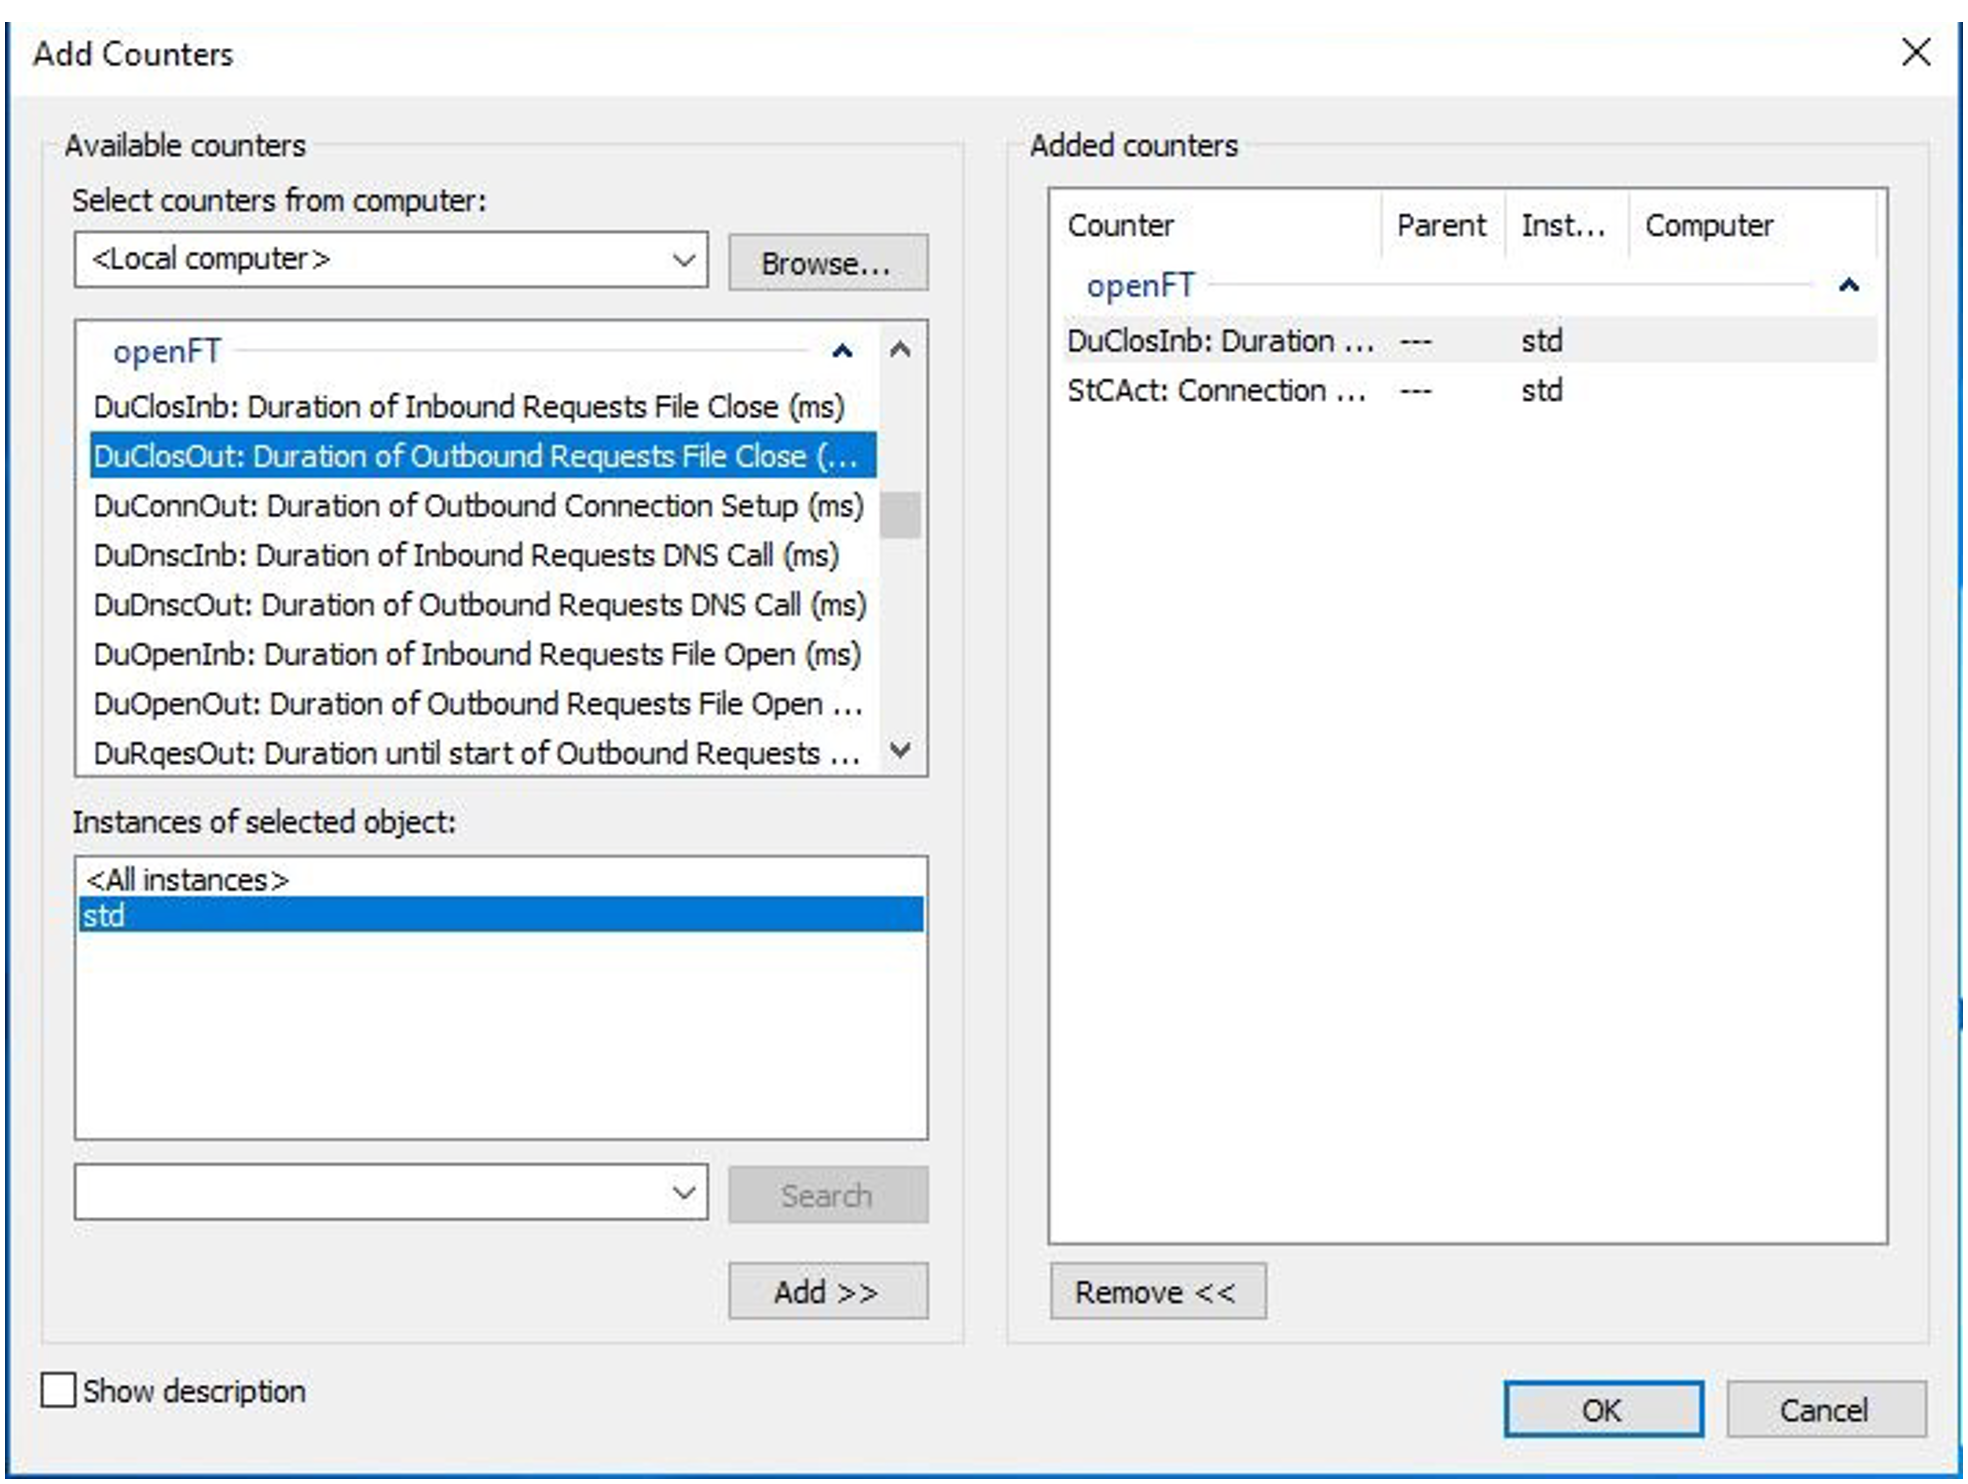
In the Add Counters window, you will find a section entitled openFT under Available counters. Select the required openFT monitoring values and, if necessary, the openFT instance and click on Add >>. The monitoring values are listed on the right under Added counters.
When you click OK, the monitoring values are recorded and displayed.
You can remove the openFT monitoring values from the Windows Performance Monitor again by selecting them and clicking on Remove <<.