If monitoring is executed under VM2000 control within BS2000 systems, the following special considerations are applicable for the implementation of the SM2 program and for the interpretation of the monitored data. Generally speaking, SM2 is executable under any guest system and provides monitored data relevant to the respective local guest system.
Notes on the CPU utilization values
The sum of TU + TPR + SIH + IDLE is relativized in every guest system to 100%. This applies for
SM2 in the ACTIVITY, PERIODIC TASK and CPU reports (NORMED column)
SM2R1 in the report group CPU (report 1)
openSM2 Manager in the reports TotalTime and NORM of the report group CPU-Total, reports TUTime[%], TPRTime[%], SIHTime[%] and IdleTime[%] of the report group CPU and reports JobCPUTime[%], TSNCPUTime[%] and UIDCPUTime[%] of the report group PERIODIC-TASK
The result of this relativation is the manual formation of the sums of the percentage load for all guest systems, not the total CPU utilization.
The non-relativized values for TU, TPR, SIH and IDLE, i.e. the real utilization values ascertained by the guest system concerned, are output in
SM2 in the CPU report (REAL column)
SM2R1 in the report groups CPU (report 2) and PERIODIC-TASK-JOBNAME (report 161), PERIODIC-TASK-TSN (report 153) and PERIODIC-TASK-USERID (report 157)
openSM2 Manager in the reports TotalTimeReal and REAL of the report group CPU-Total and reports TUTimeReal[%], TPRTimeReal[%], SIHTimeReal[%] and IdleTimeReal[%] of the report group CPU
The relationship between the data in the CPU report (REAL column), the data in the VM report (CPU MEAS) and the data in the PERIODIC TASK report (CPU%) is explained in detail in the following section.
Furthermore, non-relativized values for TU + TPR are output on a category-specific basis in
SM2 in the CATEGORY report
SM2R1 in the report group CATEGORY-CPU (62 report)
openSM2 Manager in the report CPUTime[%] of the report group CATEGORY
The time equivalent of the CPU time per category is also based on non-relativized times in SM2R1 in the report group RST (60 report)
The CPU time given in the task statistics of SM2R1 is likewise the real CPU time consumed by a task in processor states TU + TPR.
A summary of the overall CPU utilization, distribution of the CPU capacity among the individual guest systems, and the CPU time used by the individual guest systems is represented for the SM2 which is brought to execution on the monitor VM.
If SM2 is running on the “normal” guest system, only the values of the local guest system, the local CPU pool and the local VM group are output.
For information on the accuracy of the TU and TPR times, see "Notes on particular variables".
Correlation between VM, CPU and PERIODIC TASK reports
VM report:
 HOST0001 SM2 VM                  CYCLE:   60 S               <date>    <time>

 HYPERVISOR:  IDLE:  15.3%  ACTIVE:   7.2%    MEAS:  77.5%    # USABLE CPUS:   3
 -----+----------+----------+----------+-+--------+-----------------------+-----
  IND |   NAME   | VM-GROUP | CPU-POOL |I| MEMORY |        CPU (%)        |  #
      |          |          |          | |  (MB)  |  MAX     PLAN    MEAS | CPUS
 -----+----------+----------+----------+-+--------+-------+-------+-------+-----
    2 | HOST0001 |          | *STDPOOL | |   3840 |    66 |    40 |  41.0 |   2
 -----+----------+----------+----------+-+--------+-------+-------+-------+-----
# USABLE CPUS is the number of real CPUs, available to BS2000 guest systems (also extra CPUs). This can be less than the number of real CPUs which exist.
CPU MEAS (%) is the VM’s share of the performance provided by the CPUs currently available:
CPU MEAS (%) = (CPU time * 100) / (CYCLE * # USABLE CPUS)
where CPU time is the total measured CPU time for the VM and CYCLE is the length of the SM2 monitoring cycle.
CPU PLAN (%) also relates to the server performance currently available.
Servers with /390 architecture
The sum of the hypervisor’s active time and the shares of all VMs shows the overall utilization of the server:
CPU total (%) = HYPERVISOR ACTIVE (%) + sum CPU MEAS (%)
or
CPU total (%) + HYPERVISOR IDLE (%) = 100 %
Servers with x86 architecture
The sum of the active time of the domain DOM0 (which can be obtained from the VM CPU POOL report) and the percentages of all VMs presents the total utilization of the server:
CPU total (%) = CPU (%) of CPU pool *POOL0 + Sum CPU MEAS (%)
CPU report:
 HOST0001 SM2 CPU                 CYCLE:   60 S                    <date> <time>

      | NORMED TO 100 %           |      | REAL
 -----+------+------+------+------+------+------+------+------+-------
  LM  | TU % | TPR %| SIH %|IDLE %|STOP %| TU % | TPR %| SIH %|IDLE %
 -----+------+------+------+------+------+------+------+------+-------
  AVG |  8.4 | 26.5 | 26.3 | 38.6 |  0.0 |  8.2 | 26.0 | 25.8 | 37.8
 -----+------+------+------+------+------+------+------+------+-------
   1  |  9.9 | 25.1 | 26.1 | 38.7 |  0.0 |  9.7 | 24.6 | 25.6 | 38.0
   2  |  0.0 |  0.0 |  0.0 |  0.0 |100.0 |  0.0 |  0.0 |  0.0 |  0.0
   3  |  6.9 | 27.9 | 26.5 | 38.4 |  0.0 |  6.8 | 27.4 | 26.0 | 37.7
 -----+------+------+------+------+------+------+------+------+-------
The real CPU utilization relates to the number of virtual CPUs of the VM which are currently active.
TU% + TPR% + SIH% = (CPU time * 100) / (CYCLE * # CPUS)
This provides the following correlation with CPU MEAS (%) from the VM report:
CPU MEAS (%) = (TU% + TPR% + SIH%) * # CPUS / # USABLE CPUS
The following correlation exists between the normed and real CPU times in the CPU report:
TU normed % = (TU% * 100) / (TU% + TPR% + SIH% + IDLE%)
and analogously for TPR normed % and SIH normed %.
PERIODIC TASK report:
 HOST0001 SM2 PERIODIC TASK (S-U) CYCLE:   60 S                   <date>  <time>

   TU + TPR=  35.0 %   SIH= 26.4 %   IDLE= 38.6 %    IO(1/S)= 3724.1   ( 2 LM'S)

  TSN | USER-ID  | JOBNAME  |T|SERV-RATE| CPU% | IO(1/S)|  UPG   |PAG RD| CRYPT
 -----+----------+----------+-+---------+------+--------+--------+------+-------
 BCAM |          |          |S| 28898.1 |  0.2 | 3424.3 |    392 |  0.0 |    0.0
 4H5N | UID      | JOB1     |B| 18085.9 | 10.4 |  142.9 |    206 |  0.0 |    0.0
 4HZF | TSOS     | PALL301N |B| 13351.9 |  3.8 |    4.1 |   2767 |  0.0 |    0.0
 BCA0 |          |          |S| 10240.1 |  7.6 |    0.0 |      6 |  0.0 |    0.0
 4IB1 | UID2     | E        |D|  8629.4 |  5.0 |   98.8 |   2053 |  0.0 |    0.0
   DM |          |          |S|  3208.2 |  2.3 |   11.4 |     23 |  0.0 |    0.0
 4H1Y | TSOS     | SHCUSERT |T|  1337.1 |  0.9 |    6.2 |     83 |  0.0 |    0.0
 4H1X | TSOS     | SHCUSERT |T|  1238.0 |  0.8 |    5.7 |     83 |  0.0 |    0.0
 3RFE | UID      | JOB2     |B|   941.3 |  0.5 |    0.0 |   3791 |  0.0 |    0.0
 SM2G |          |          |S|   792.6 |  0.5 |    0.0 |    794 |  0.0 |    0.0
 MSCF |          |          |S|   540.0 |  0.4 |    0.0 |     18 |  0.0 |    0.0
 NSMS |          |          |S|   400.3 |  0.3 |    0.0 |     30 |  0.0 |    0.0
 0HA7 | UID3     | MMNLQX9  |T|   396.9 |  0.2 |    0.0 |   3308 |  0.0 |    0.0
 4H0J | UID      | JOB1     |D|   338.3 |  0.2 |    0.4 |   1257 |  0.0 |    0.0
 4ICU | TSOS     | RMF#4ICS |B|   296.3 |  0.1 |    0.4 |   2404 |  0.0 |    0.0
CPU% is calculated like the standardized CPU time in the CPU report.
The values from the CPU% column totalled for all tasks provide TU + TPR.
The following applies for the CPU time of a task:
CPU% < 100 / LM'S
where LM'S = number of active logical machines.
The values for TU + TPR, SIH and IDLE are normed values, i.e. they match the “NORMED TO 100 %” values in the CPU report:
The CPU time of a task can be calculated from the PERIODIC TASK report and CPU report:
CPU% real = CPU% * (TU% + TPR% + SIH% + IDLE%) / 100
Non-relativized values are output in SM2R1 in the report groups PERIODIC-TASK-JOBNAME (161 report), PERIODIC-TASK-TSN (153 report) and PERIODIC-TASK-USERID (157 report)
Notes on the IDLE values
The overall CPU utilization is determined by taking the HYPERVISOR-IDLE value and extrapolating the difference to 100%.
The IDLE value for a guest system given by the SM2 monitoring program loses its original meaning, in which case it merely acts as an indicator of the percentage for a given time period, one during which the respective guest system was inactive of its own volition,
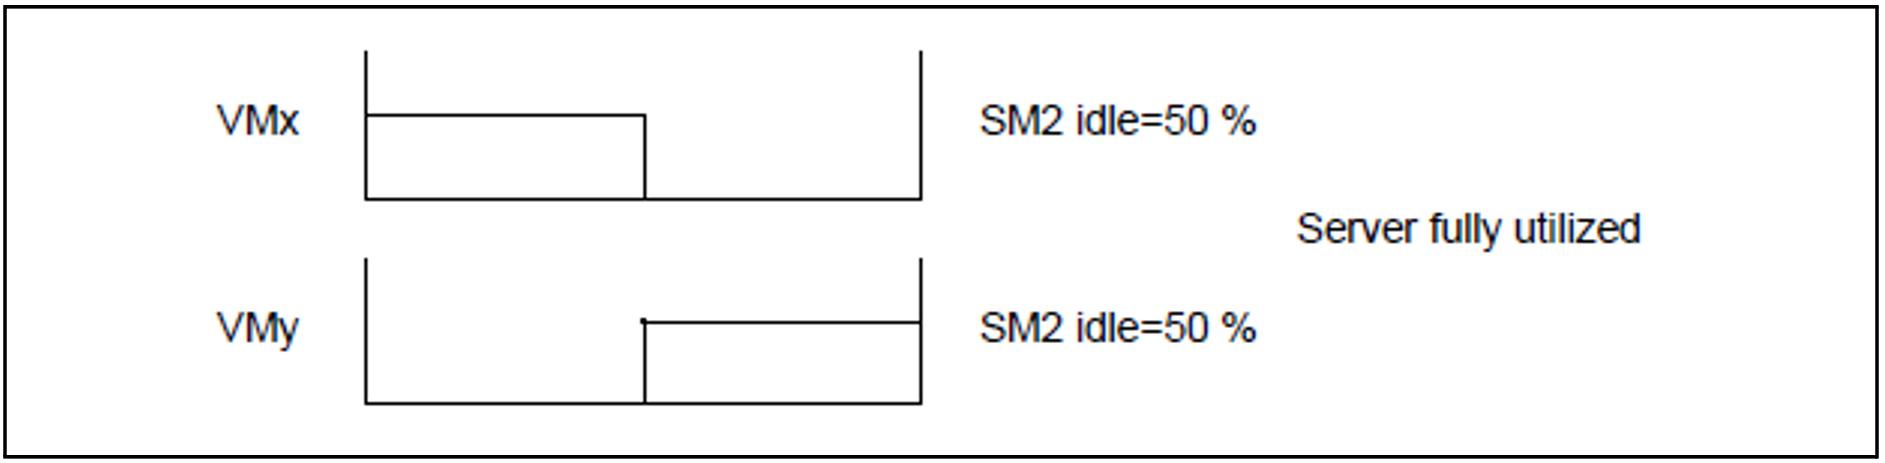
e.g. 2 guest systems, VMx and VMy:
Each guest system is to be active for 50 s within the period of 100 s.
Ideal situation: No idling occurs.
Realistic case: idling does occur for half of the required active period (***).
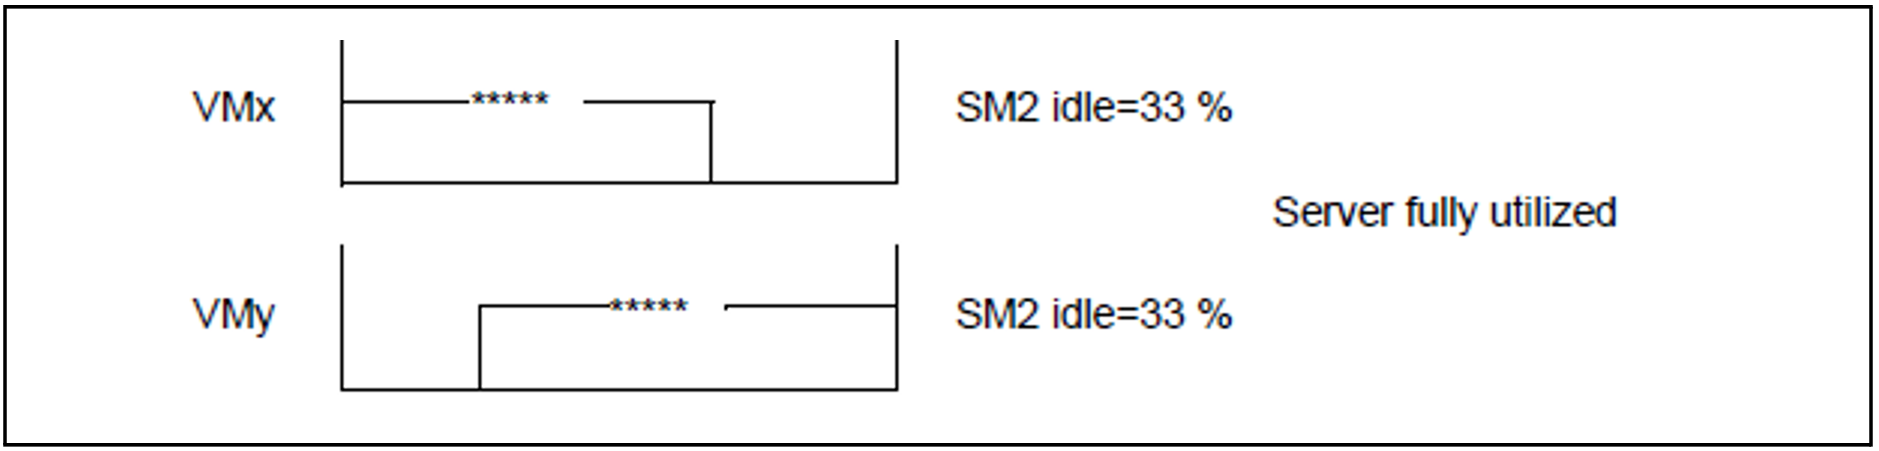
The SM2 idle value of 33% is explained by the fact that SM2 precisely monitors the active time (50 s), adds the voluntary inactive time (reduced to 25 s as the result of idling), and relativizes it to 100%.
Even if server utilization is 100%, it makes sense for SM2 to provide an IDLE value for the following reasons:
Full utilization of server load can be the result of a low-priority guest system which has highly intense CPU time (in the extreme case: CPU loop), the system always obtaining control as soon as the other guest systems voluntarily revert to IDLE mode.
The SM2 IDLE value permits the operator of a high-priority guest system to estimate the extent to which additional load can be utilized. In this case the lower-priority system is idle to the appropriate degree specified.
Influence of other guest systems on monitored data
The general rule is: dilation resulting from other guest systems is always included in all SM2 monitoring values formed by the difference between two time values.
This includes the following monitoring information:
all I/O times for the monitoring programs TASK, SYSTEM, SAMPLING-DEVICE and FILE
response times for the monitoring program RESPONSETIME and BCAM-CONNECTION
catalog access times for the monitoring program CMS
QUEUE values in the task statistics
QUEUE values for queues Q1 to Q13 for the QUEUE-TRANSITION operand
Q0 (CPU-QUEUE) is without dilation, as the real CPU requirements from the product TU + TPR are output!
The monitoring values supplied by the SERVICETIME monitoring program (only on /390 servers), namely the values
DEVICE DISCONNECT TIME
DEVICE CONNECT TIME
FUNCTION PENDING TIME
represent the real hardware times (determined by DMS) without dilation by other guest systems. Dilation of I/O times is reflected in the (REMAINING) SERVICETIME value.
All SM2 monitored data with “per second” (1/s) units refers to the elapsed time, and not to the time for a guest system. As a result, the values determined are less than those which actually occur during the time the guest system was active (for example I/Os/sec. per disk, paging rate).
Disk utilization is determined by the sampling method while the corresponding guest system is still active, in other words the values are not corrupted by other guest systems (in contrast, the number of I/O operations does not refer to the active time per second, rather to the seconds elapsed, and therefore the value appears to be lower).
Utilization of channels (BUSY) is calculated from the data rate and the blocking of I/Os and always refers to the local guest system.
The SERVICETIME monitoring program can start the recording of the detailed service times of the DCS from only one guest system at any particular time. If an attempt is made to activate the function from a second guest system as well, a corresponding warning appears. The monitoring program is started, but no DCS-specific monitored data is provided.
The VM2000 command SHOW-VM-RESOURCES INFORMATION=*STD/*ALL can be used to check whether SERVICETIME monitoring is already active in a guest system. If it is, message VMS2035 is output.
No DCS-specific monitored data are supplied for disks with indirect I/O (VM2000).