For most test purposes, it is sufficient to start the application perfectly normally. Only if you want to debug a program unit that executes automatically when the application is started, e.g. program units for a Start-Exit or the MSGTAC program for start messages, do you have to start the application in a special way: In both cases, the following applies:
A range of test tools are available to you for testing:
On Unix and Linux systems, for example, dbx, sdb, adb, xdb, debug, gdb, Cobol test tools.
On Windows systems, the debugger that is integrated in Microsoft Visual Studio.
It is possible to connect to the application's work processes with the test tool or to start multiple work processes that are monitored by one and the same test tool.
You do not need any special UTM generation, i.e. you can also use the tested application program in production operation without having to recompile and relink it.
The full functionality of openUTM on Unix, Linux and Windows systems can be tested even with distributed applications.
As with a "real" production application, wait times are monitored by the timer process.
You can also test output jobs to printers on Unix and Linux systems.
In test operation, all the processes except for the utmwork processes are started in exactly the same way as for the production application. As a result, for example, full access is possible to and from the network.
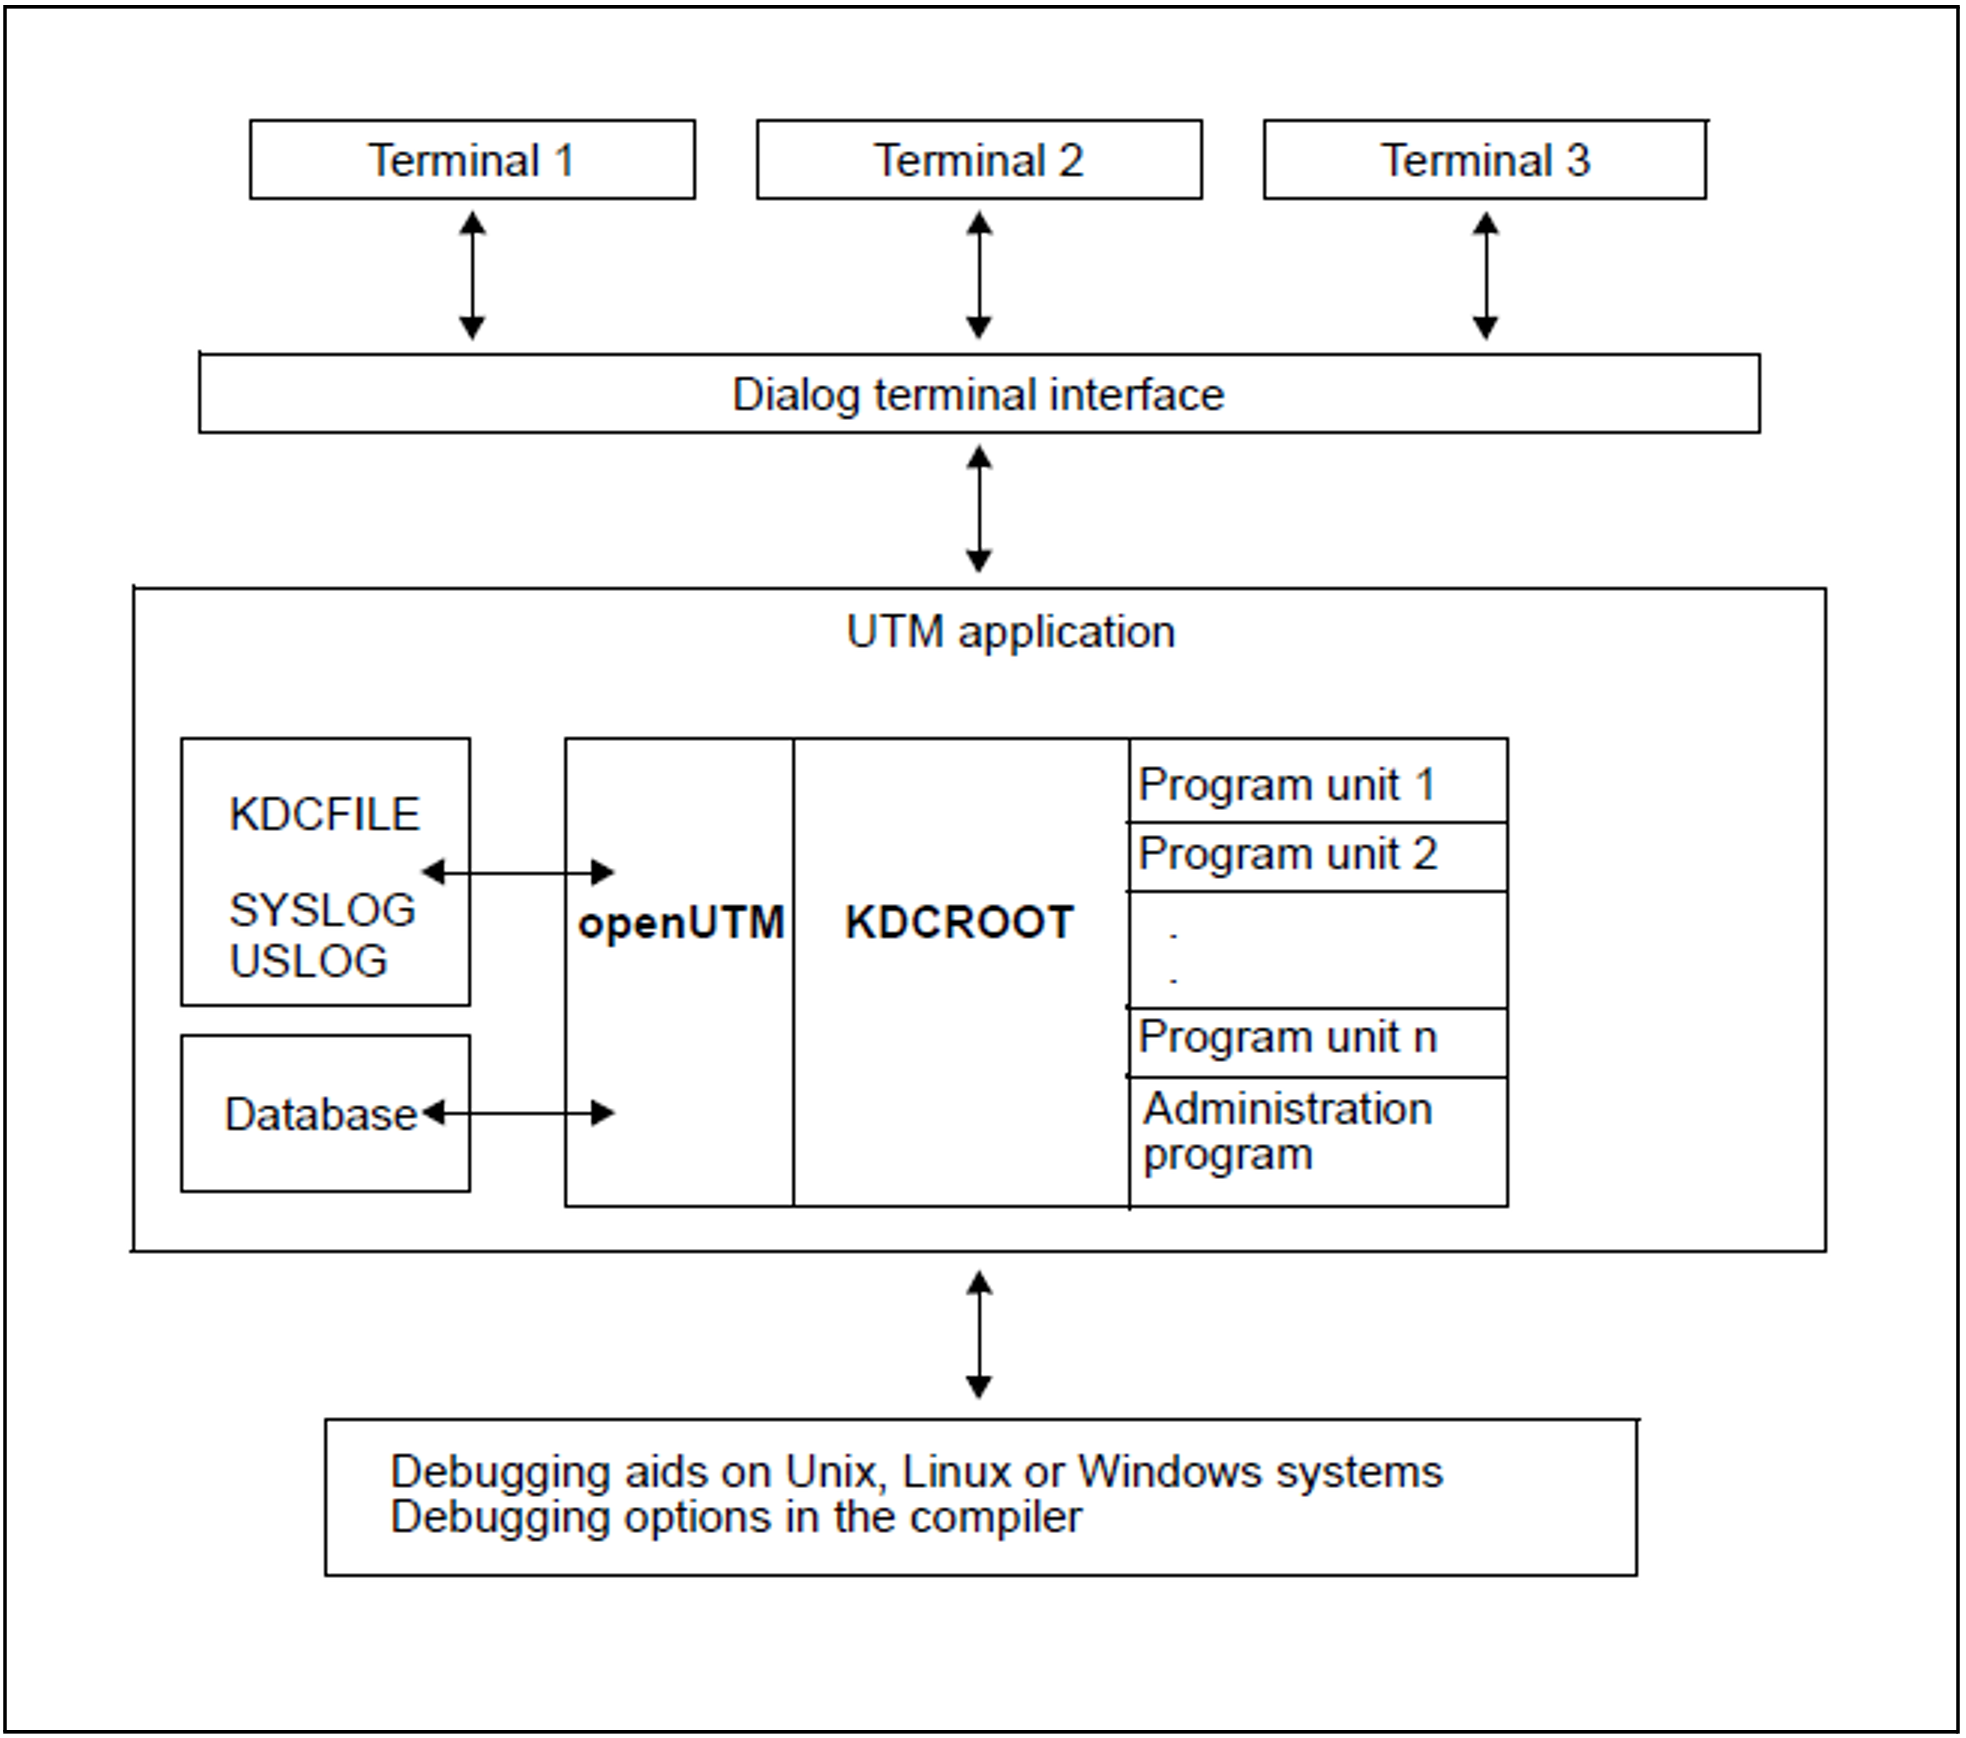
The following diagram shows the structure of an interactive test.
In addition, access from the network is also possible.