TRACE lists can be created for a more precise analysis of the execution of a UTM application. This list contains all UTM calls for the individual UTM processes in chronological order.
For space reasons, a list can contain the data from a maximum of 6 processes. If data for more than 6 processes exists for the evaluation period, the evaluation tool KDCEVAL creates a second TRACE list with the next maximum 6 processes and appends this list to the first list in the same file. It is thus possible to analyze the chronological execution of up to 12 processes.
If data from more than 12 processes exists in the evaluation period, KDCEVAL creates the evaluation lists for 12 processes. KDCEVAL does not evaluate any data for the remaining processes, and logs this fact in a UTM message specifying the TSNs.
The list is sorted in chronological order.
The TIME STAMP column contains the time stamp of the corresponding call that was logged (in microseconds).
The TRACE list records the following events and data:
The transaction code called (TAC).
The transaction ID. In openUTM, a unique transaction ID is assigned to each transaction. This identifier is also transferred to the attached databases on the UTM-DB interface. In this way, it is possible to link database traces with these UTM traces and establish relationships between UTM and DB processes. The transaction ID is made up of four parts:
SC
Session counter: This counts the application runs. The number is 1 after a regeneration, and is incremented by 1 each time the application starts.
VC
Service counter: This counts the services within the application run and runs up to 16 777 216 (224).
TC
Transaction counter: This counts the transactions within a service and runs up to 32 768 (215).
VN
Conversation number: this is the number of an internal UTM table for the administration of services.
These four parts are logged after the KDCS call INIT.
The VC and TC specifications are of interest to the user.All UTM calls with operation modifications. Internal UTM calls (WAIT, CONT, ...) are also listed.
The following are also logged:
KCMF for KCMF-relevant calls
KCRN for KCRN-relevant calls
KCLT for PADM/DADM calls
In the event of an abort with PEND ER/ FR as diagnostic information:
the TAC of the program unit that caused the abort
the return codes KCRCDC and KCRRCC
VC and TC for the assignment to the aborted service
With a PEND RS as diagnostic information:
the TAC of the current program unit
VC and TC for the assignment to the service
With DB calls FITA and CATA:
VC and TC for the assignment to the service
All database calls, if the UTM application is coordinating with a non-XA database system (generated with the KDCDEF control statement DATABASE).
Calls to such a database system are logged with the following entry:
opcode db-time
Where opcode is the operation code of the database call according to the IUTMDB interface. See also the description of DB Diagarea in the openUTM manual “Messages, Debugging and Diagnostics on BS2000 Systems”, chapter UTM dump. db-time specifies how much time was required to process the database call (real time in microseconds).
Example:
FITA 115If SESCOS is activated for a SESAM-DBH, calls to the SESAM database are logged by the following entry, which enables the assignment between TRACE list and SESCOS evaluation:
ppxyttttnnnmmmmmmmm
pp
Operation code of the database call as a hexadecimal value, e.g. 14=DBFITA. See
DB Diagarea for values.x
Configuration name of the SESAM-DBH.
Value range: 'BLANK', A-Z, 0-9
Value ‘-’: Information was not supplied by SESAM.y
Communication name of the SESAM-DBH.
Value range: 'BLANK', A-Z, 0-9tttt
TSN of the DBH task.
nnn
Serial number of the SESCOS file.
mmmmmmmm
Serial number in the SESCOS file.
The numbers nnn and mmmmmmmm are specified with leading blanks.
As long as no process switch takes place, all calls for processing a dialog step are listed in succession in the same TSN column. Following a PEND PA/PR/SP, a process switch can occur when changing a TAC class. The interruption of a process by the operating system can be seen by the fact that the calls are continued in another process column midway through the processing of a dialog step.
Below is an example of the TRACE list. It shows an excerpt from the execution of a UTM application with database calls to UDS and SESAM.
The TRACE evaluation list has the following format:
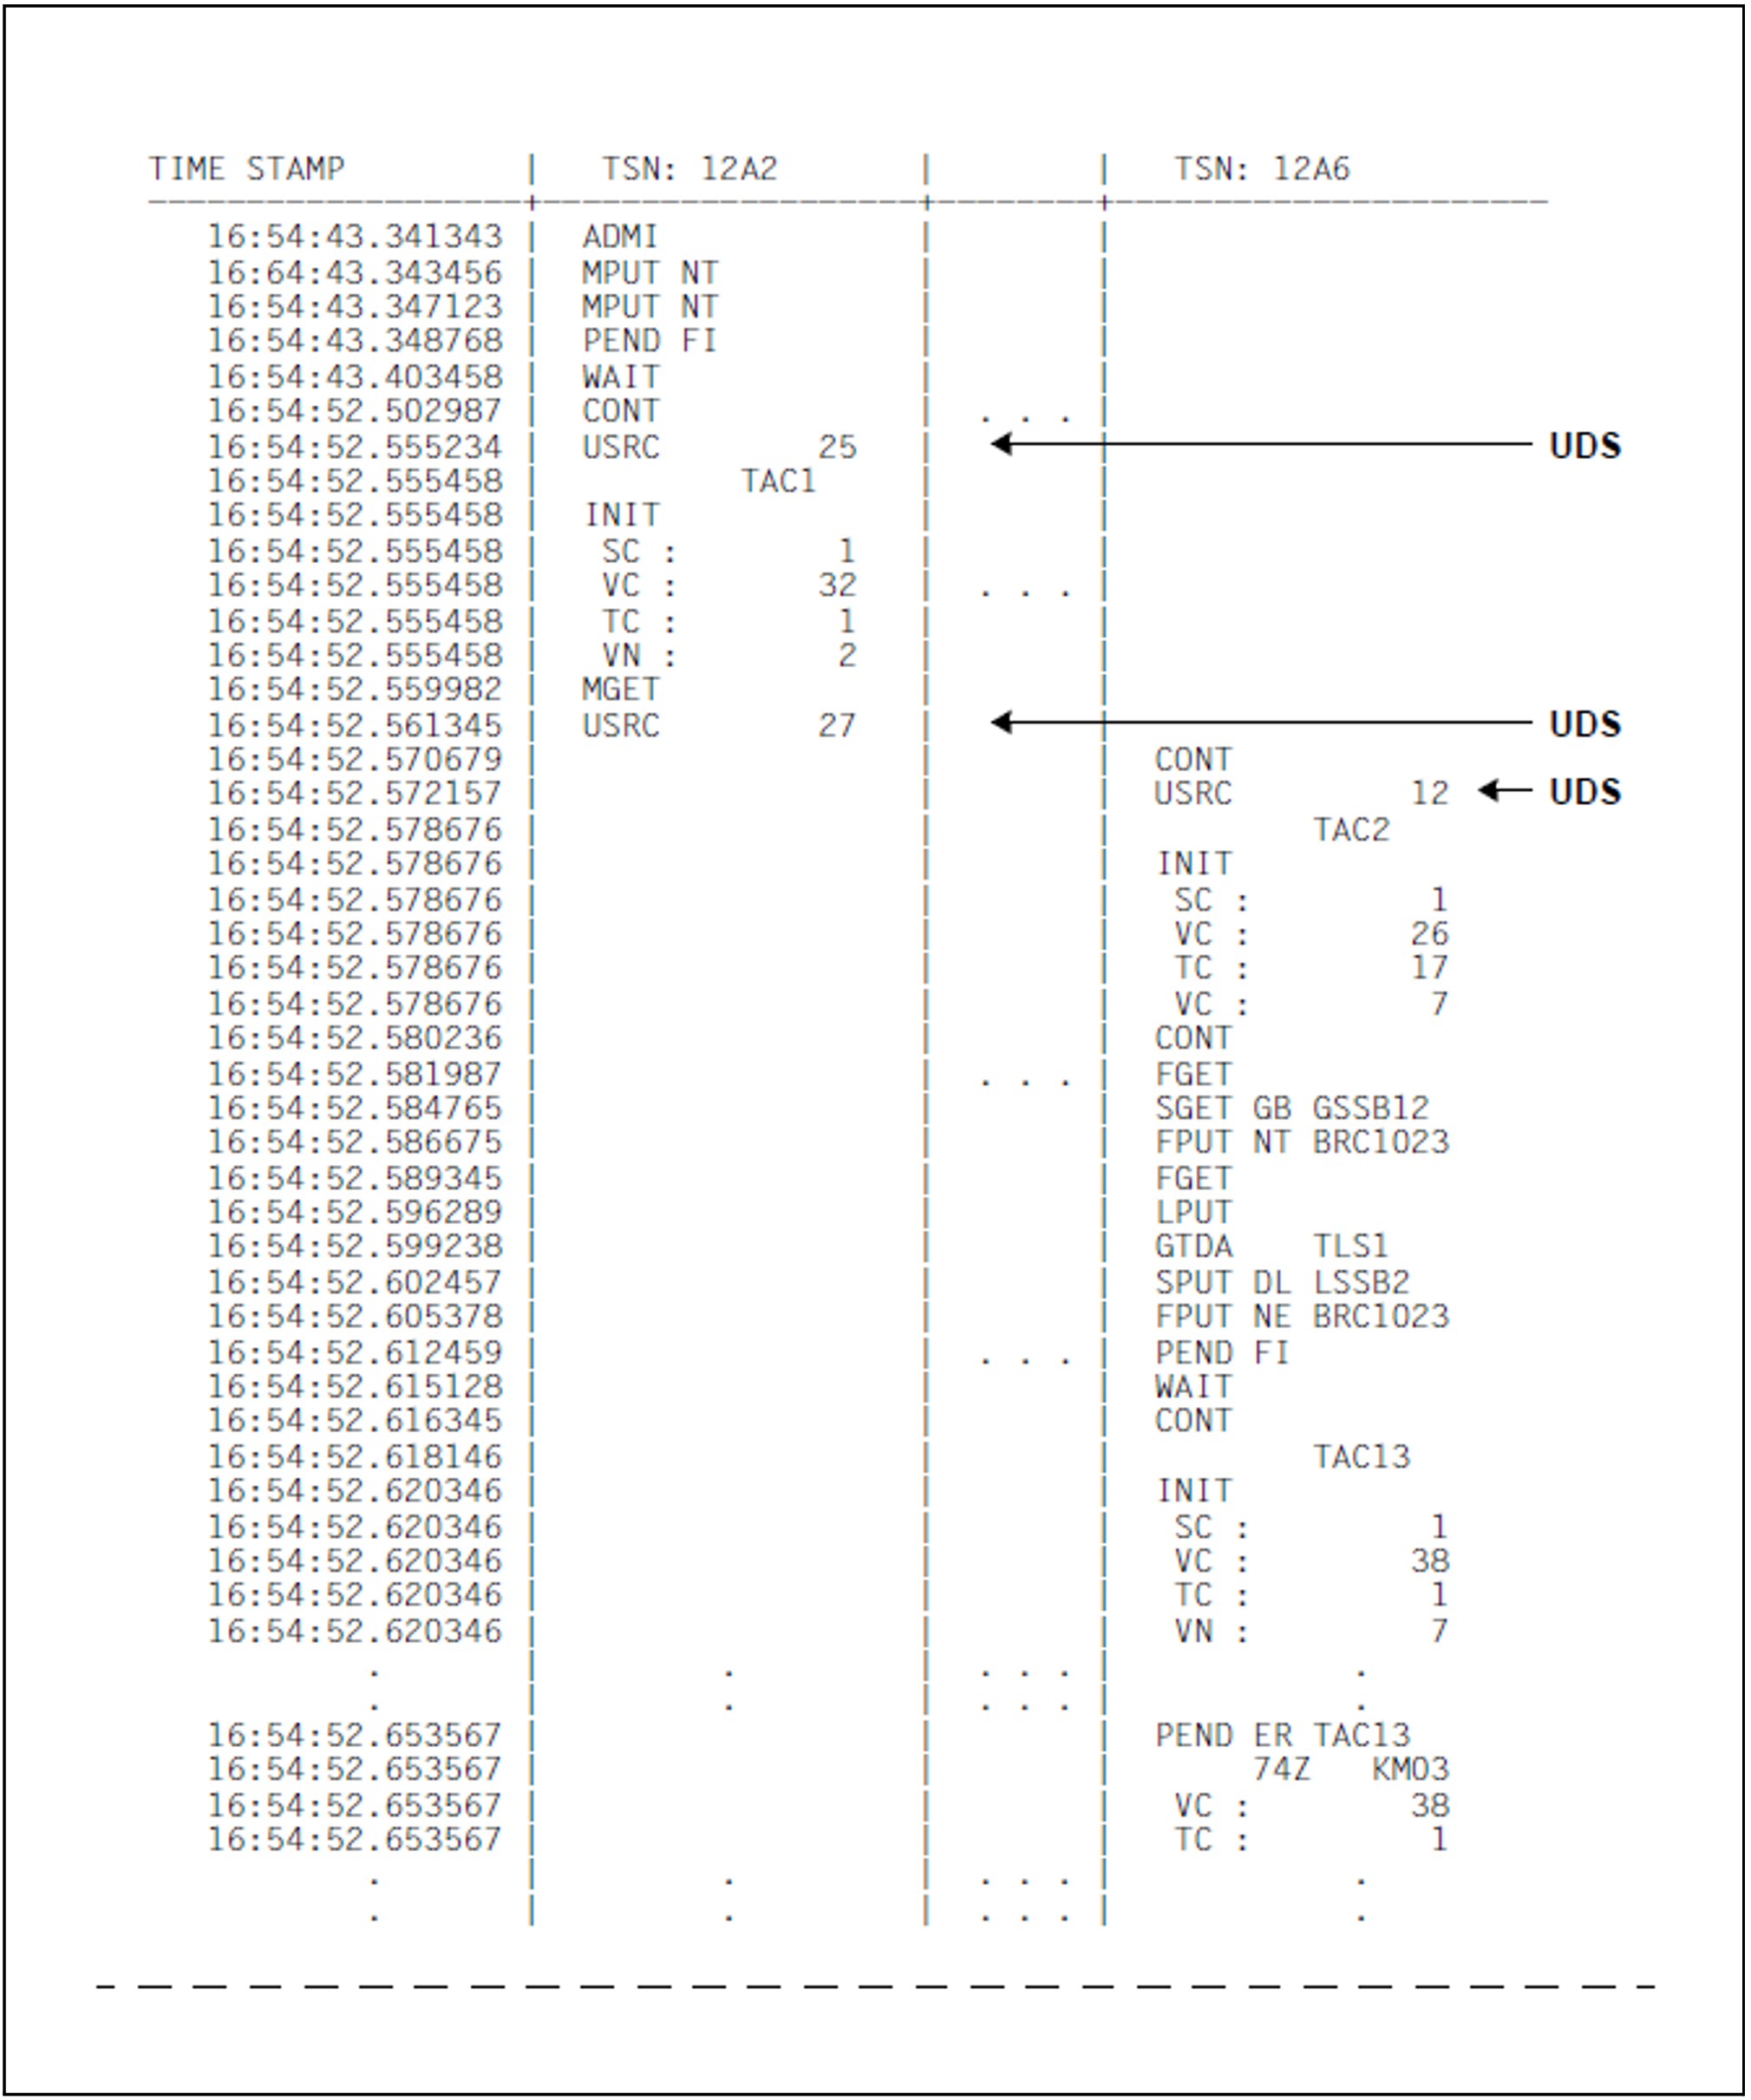
TRACE list (part 1)
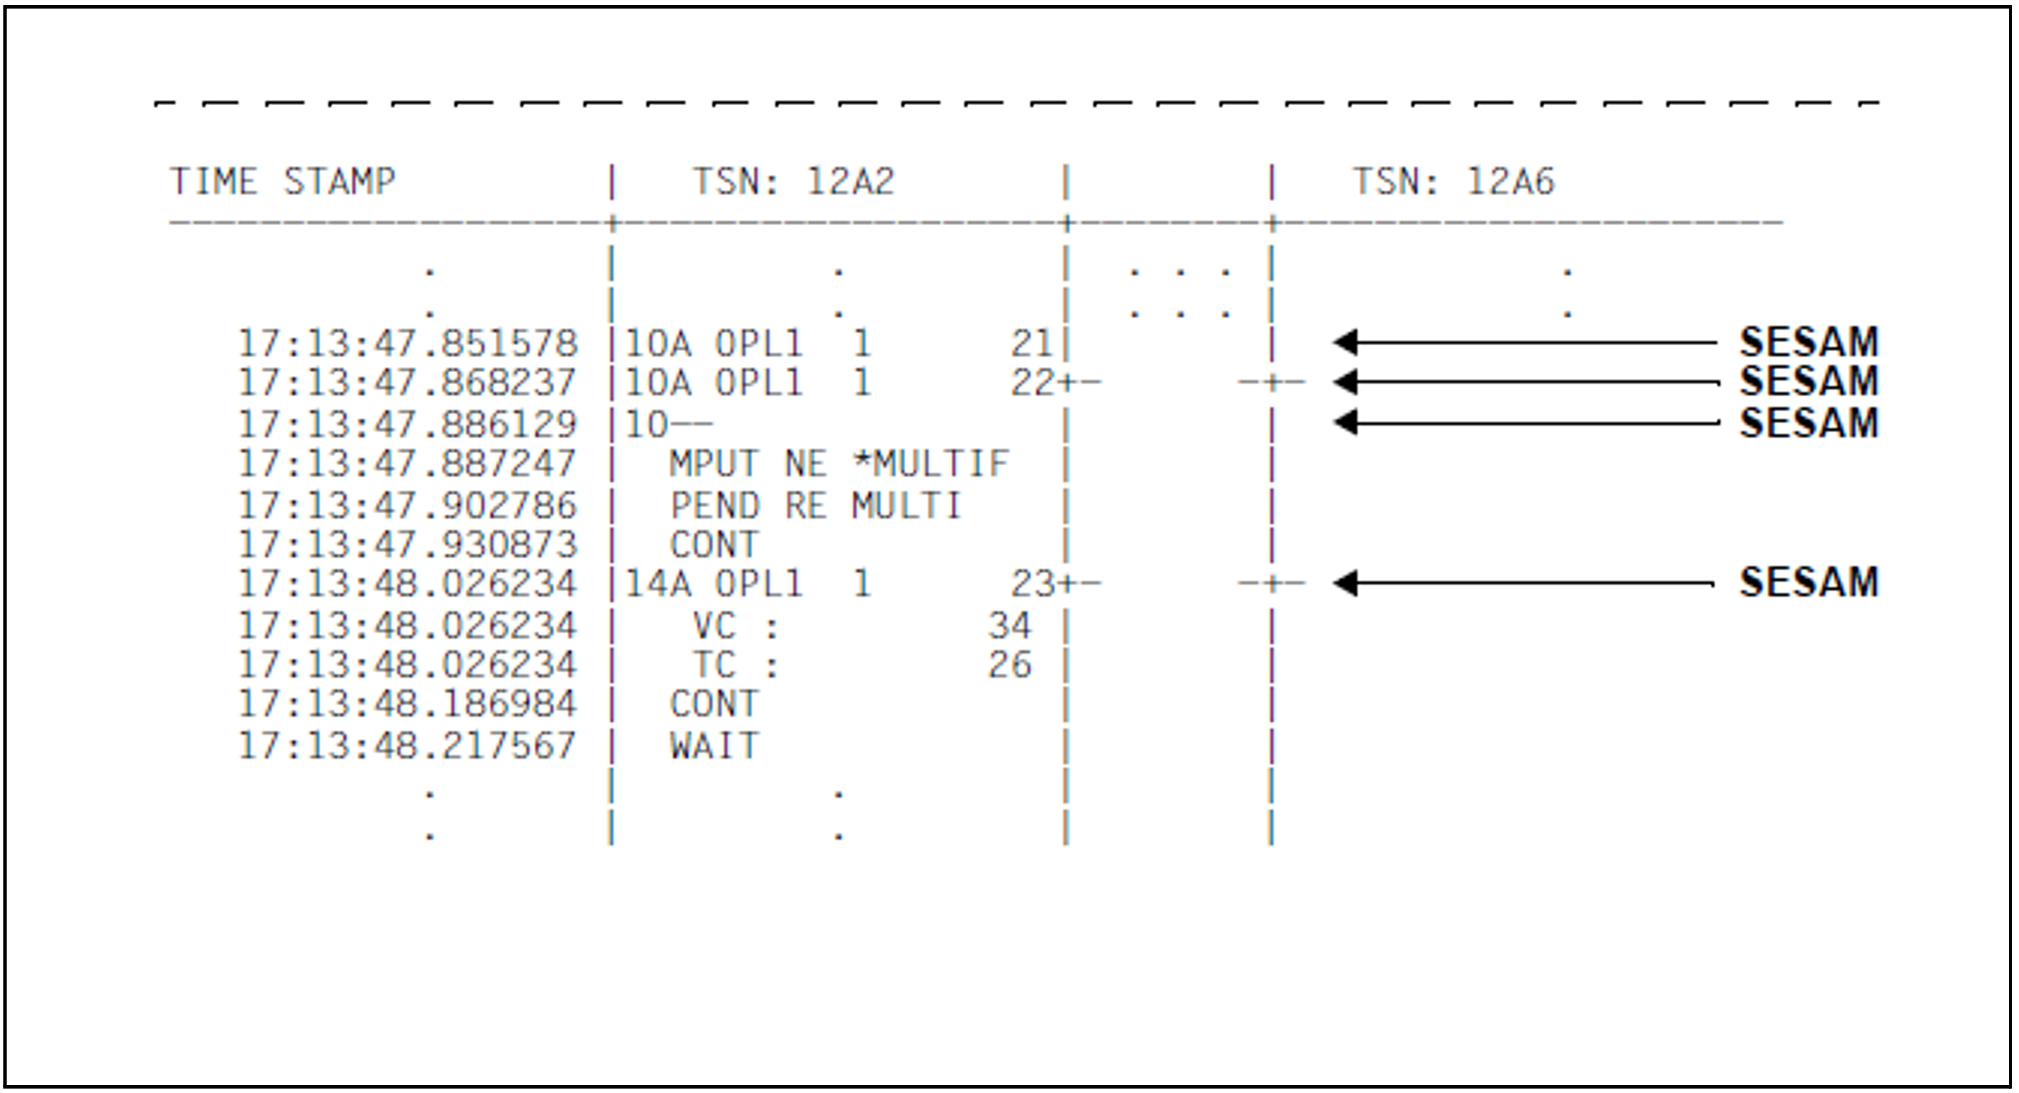
TRACE list (part 2)
To help you understand the list, the database calls in the example are identified by arrows, which are not contained in the original TRACE list.