The status window provides an overview of the opened diagnosis object. The first four lines contain general information on the type of diagnosis object and on its environment during creation (e.g. BS2000 version, CPU type or memory size).
The status window is displayed automatically on opening the diagnosis object and contains the input fields “TID”, “TSN”, “Mode select” and “Window length”.
Figure 10: Input fields in the header line for the status window
Mode select
The information shown in the “Mode select” input field for the status window (W2) can be influenced by different modes. The possible modes are INF, TSK, PLK and SLK:
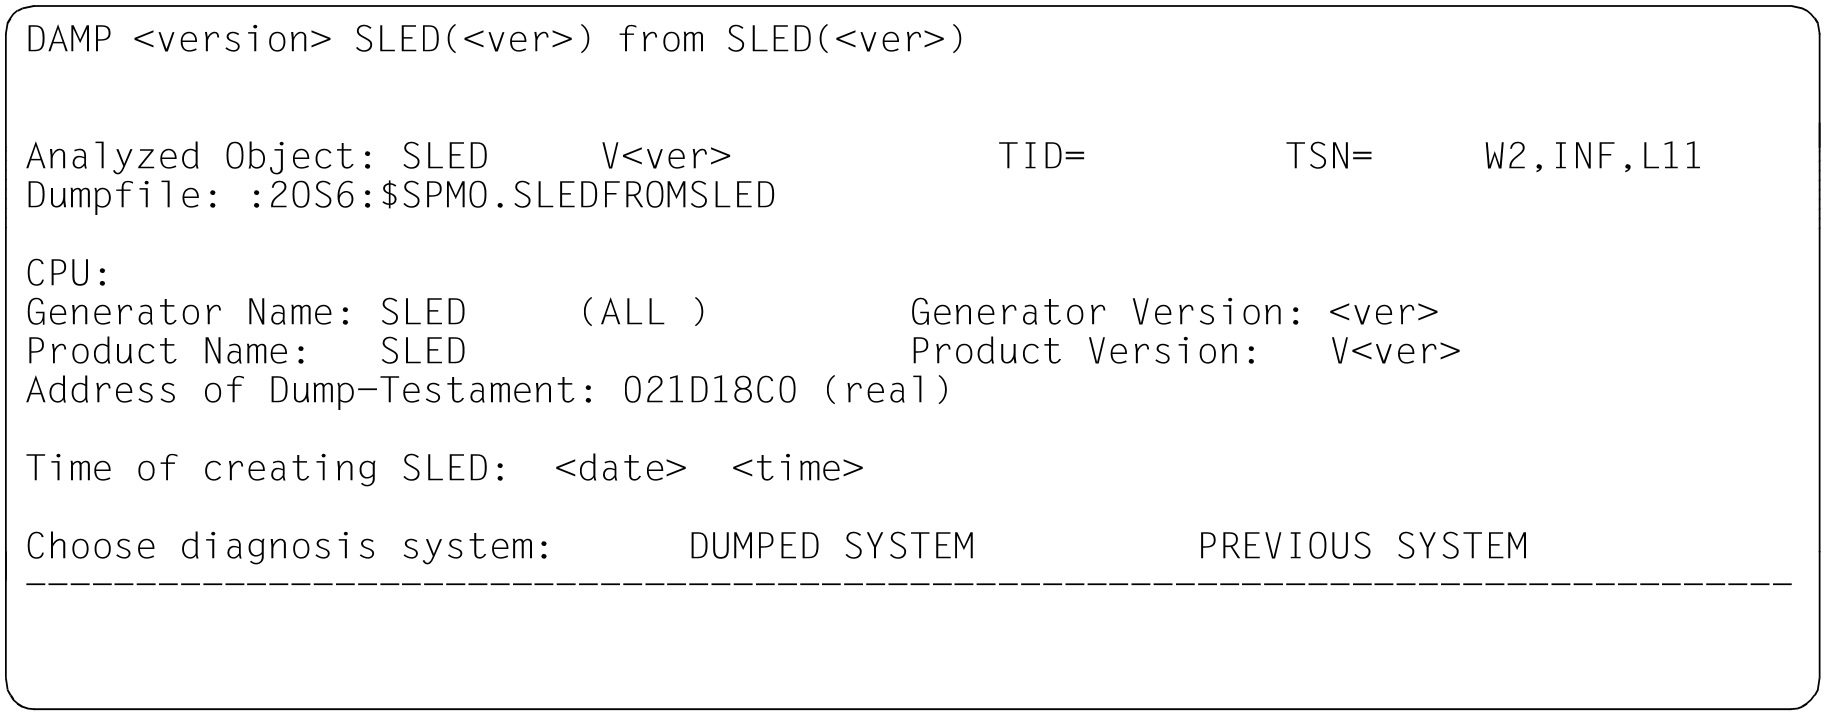
INF | Besides the standard details displayed in the first three lines of the status window, additional information on the dump generator, diagnosis object and selected product is returned. The INF mode is set automatically if the dump file containsmore than one object (product), e.g. in the case of a complete VM2000 SLED. DAMP can analyze the following objects:
Example windows for the mentioned object types can be found as of "The status window (W2)". The mode can be set by the user by means of the “INF” entry in the header line. If an object selection was made in dump files with multiple objects (complete VM2000 SLED, SLED from a SLED / Dump from a SLED), entering “-” / in INF mode cancels the selection. In INF mode, as much information as possible is displayed. One exception is theso-called SELF-LOADER (see "Editing SLEDs without a BS2000 structure").
By marking (see section "Marking" (Modifying the diagnostic windows)) the address of the dump testament, the memory contents of the dump testament can be output to a standard window with the RM or ABS addressing mode. Depending on the dump file type, the following information is included:
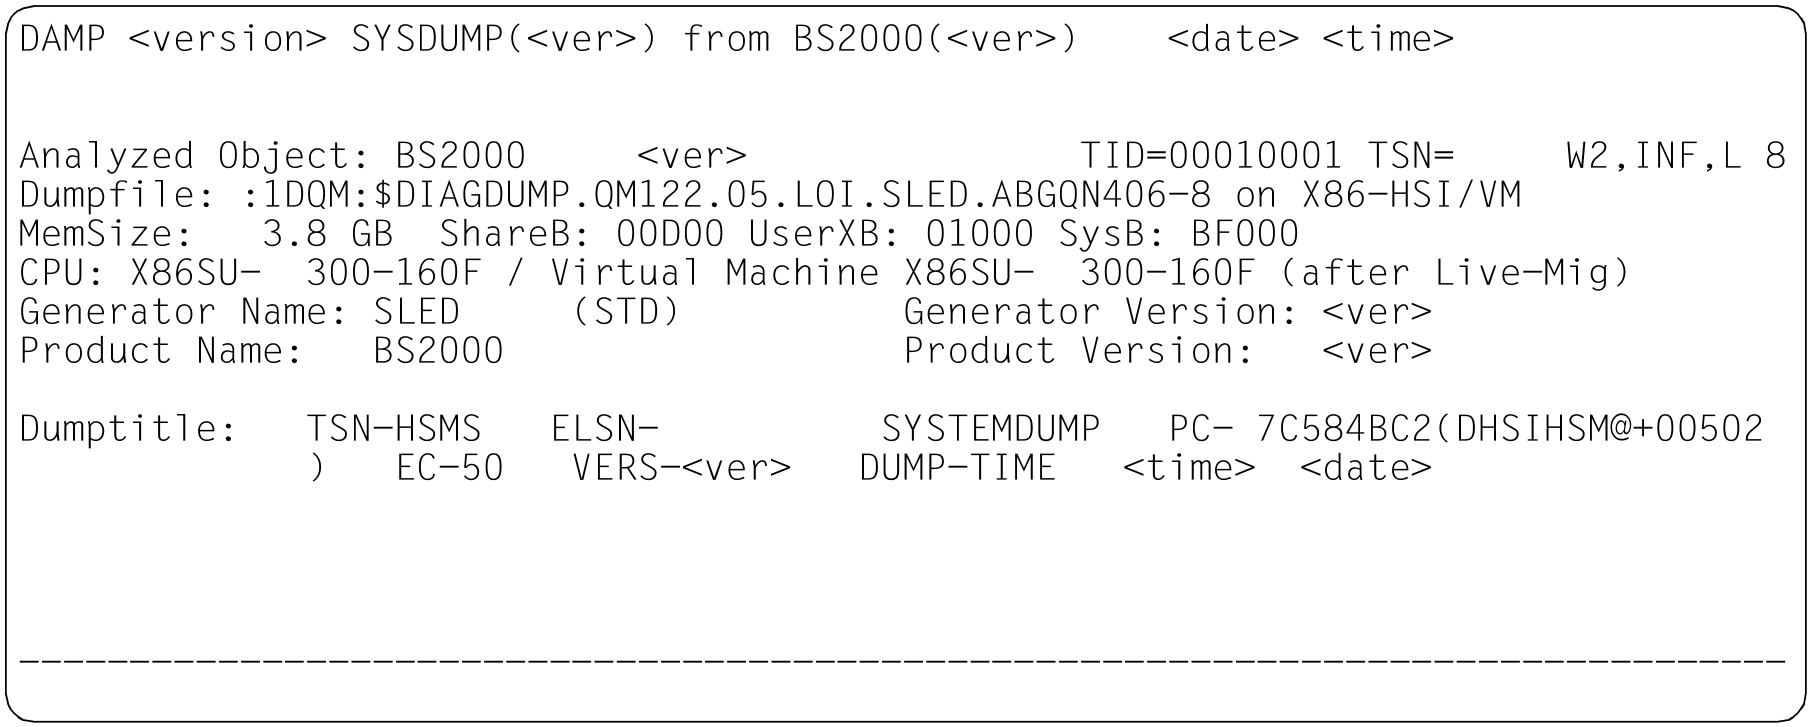
Example windows for the various dump file types in INF mode Figure 11: Information screen in the status window (W2). Dump created by CDUMP. Dump object: BS2000 (SU x86 after Live Migration) |
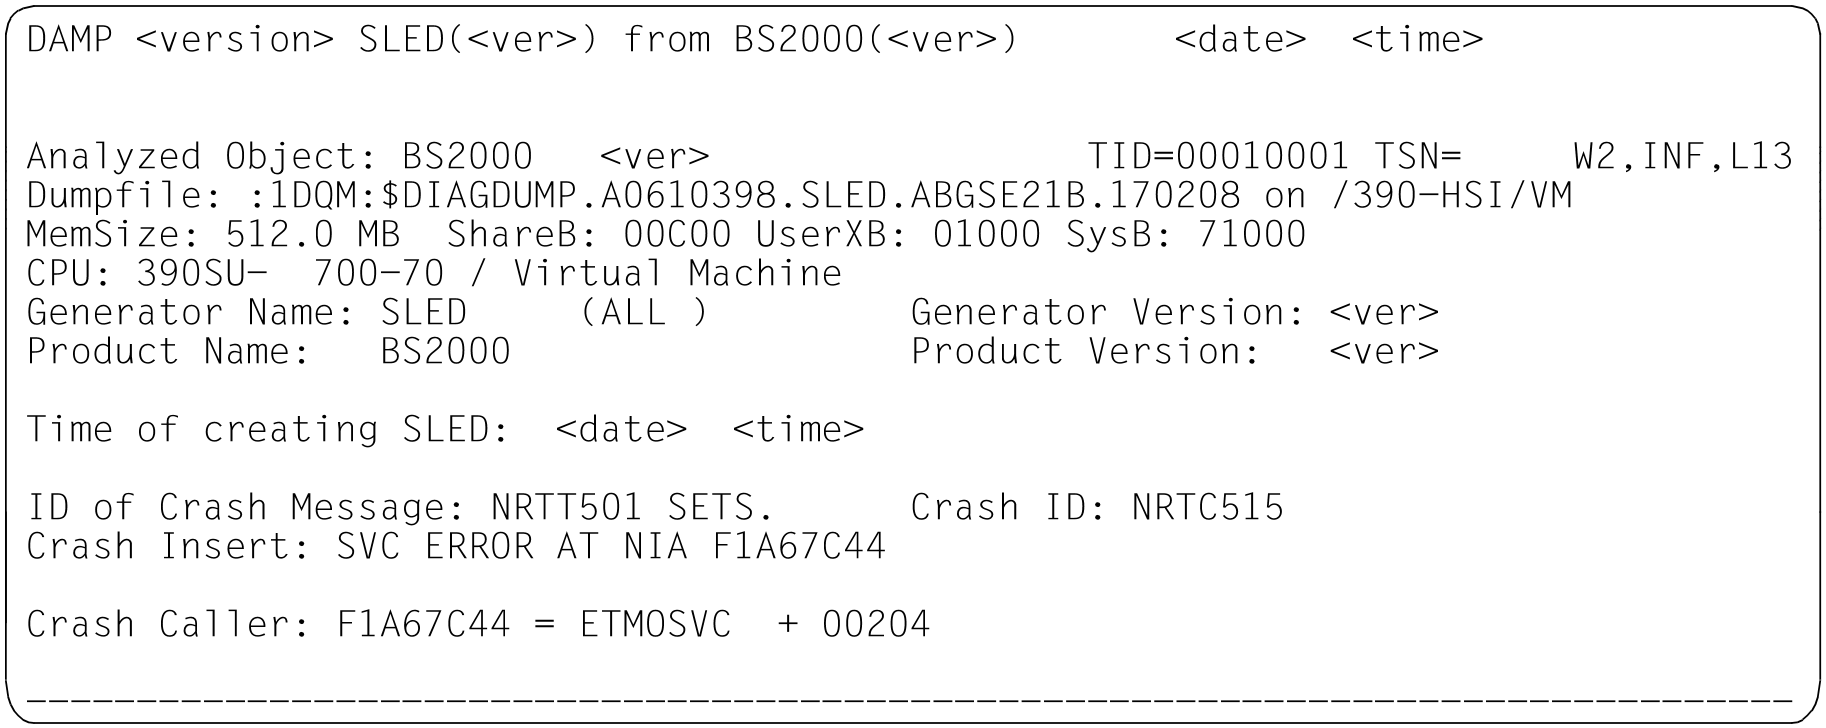
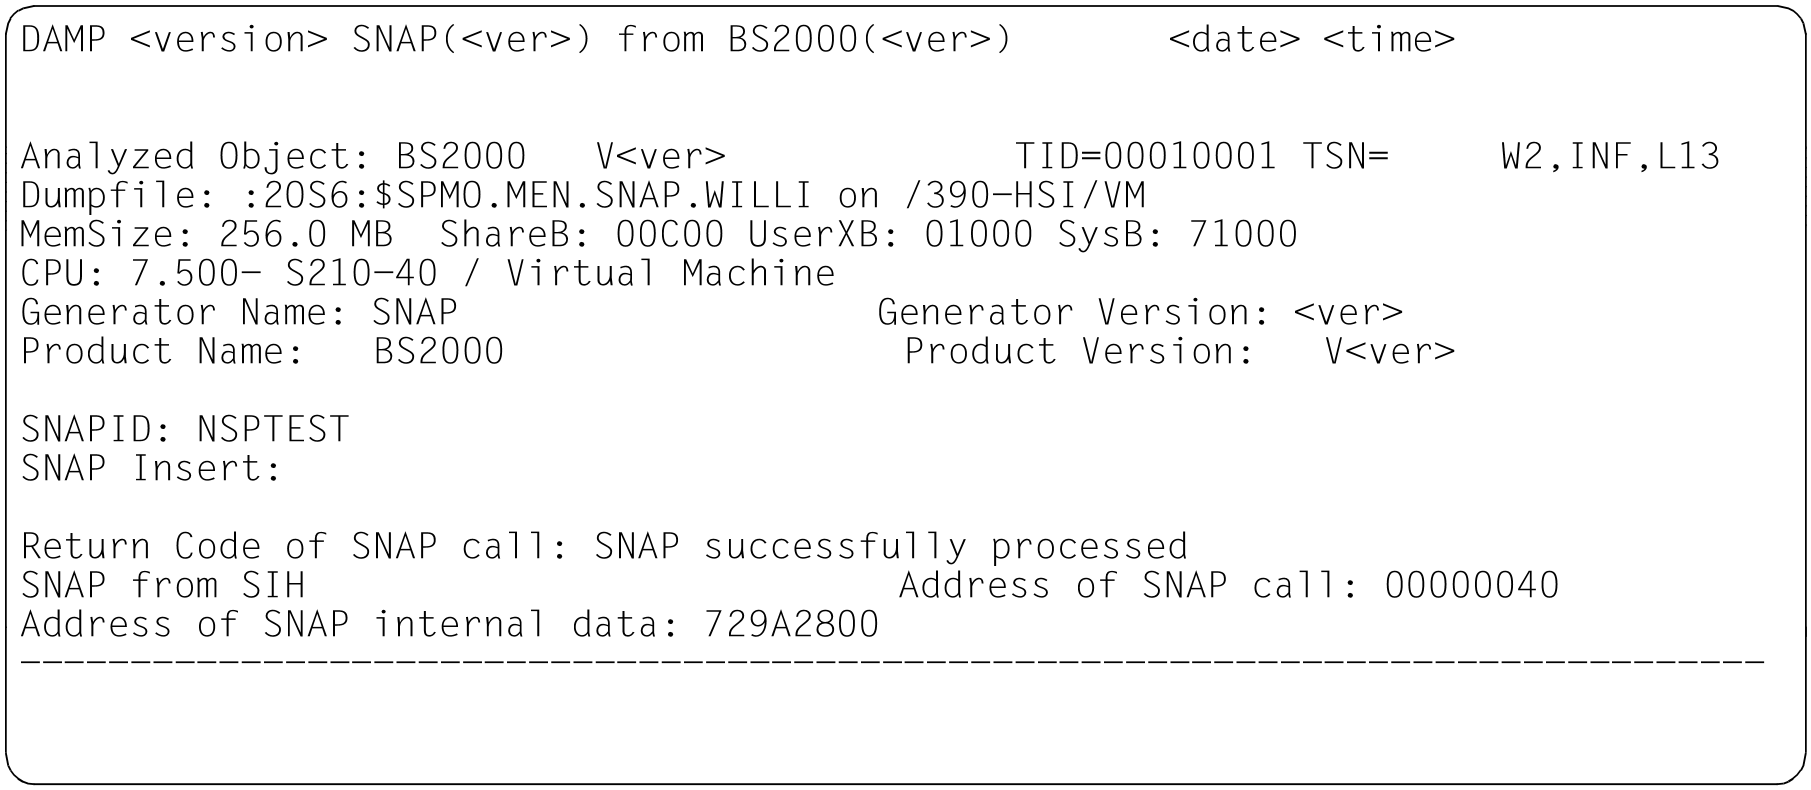
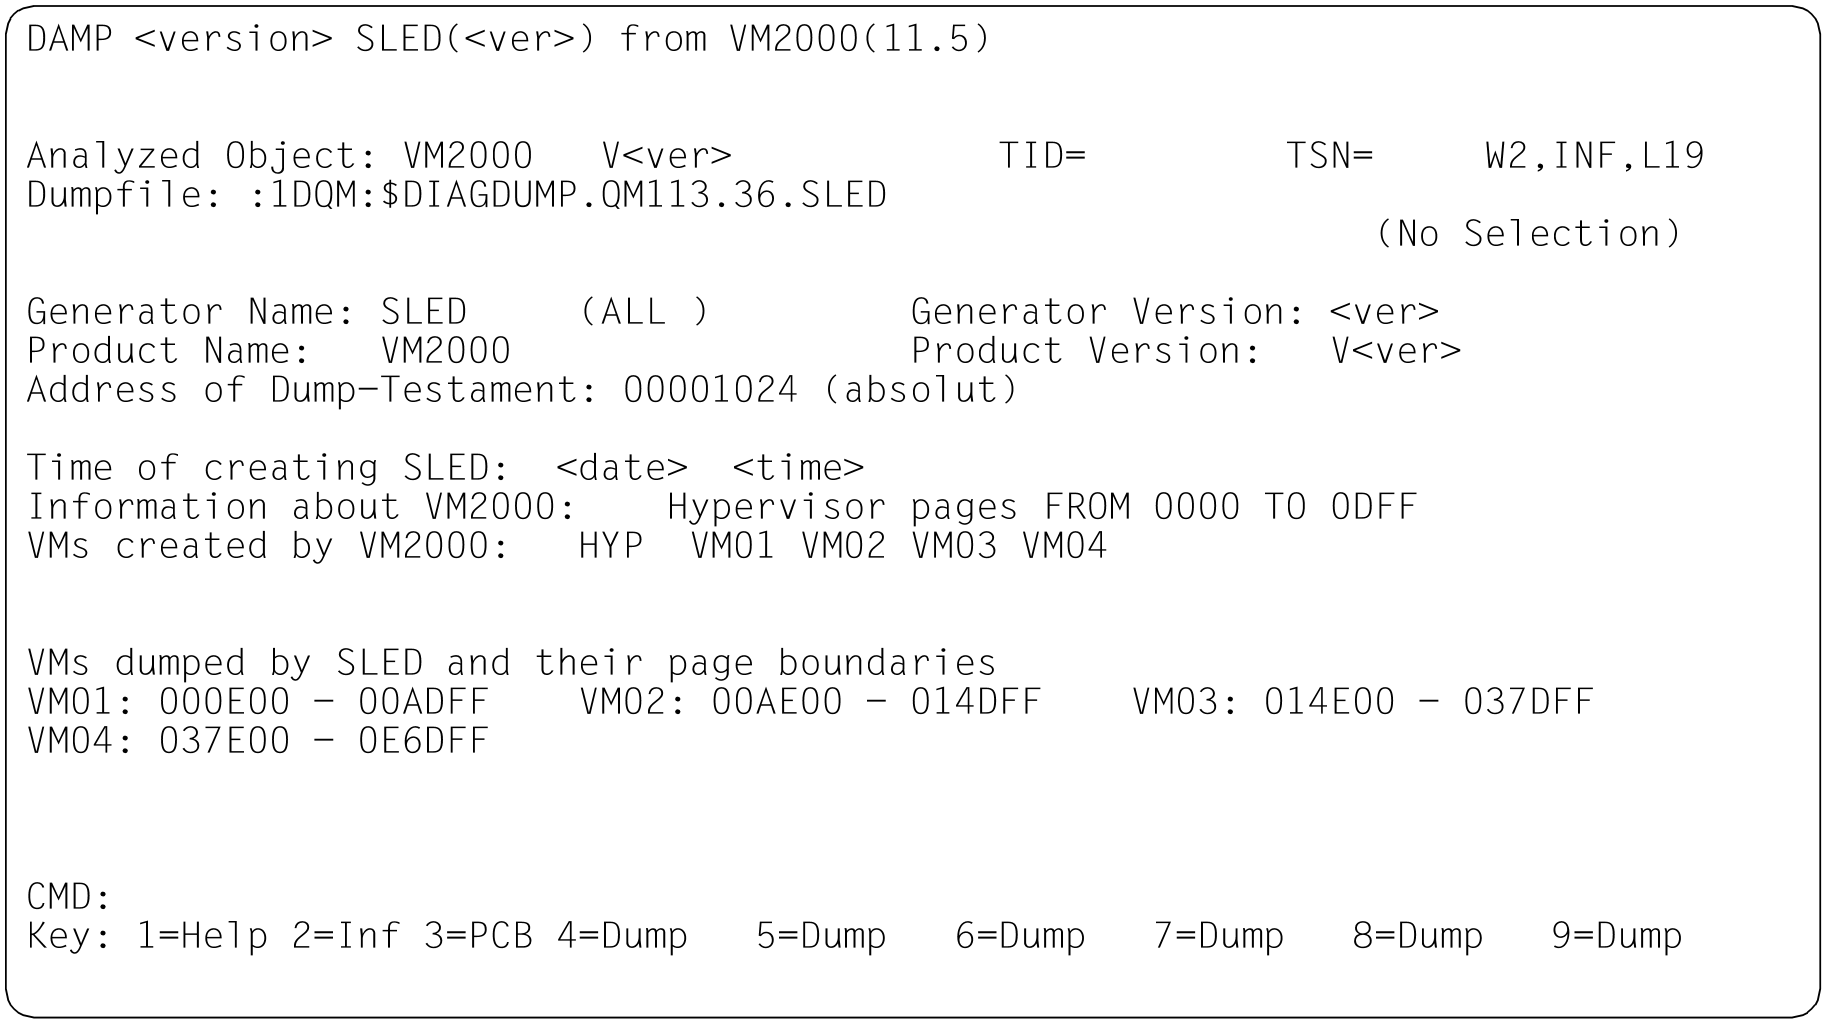
INF | Figure 12: Information screen in the status window (W2). Dump created by SNAP. Dump object: BS2000 (SU /390 after abnormal system termination) Figure 13: Information screen in the status window (W2). Dump created by SLED. Dump object: BS2000 (S server) Figure 14: Information screen in the status window (W2). Dump created by SLED; dump object: VM2000 Figure 15: Information screen in the status window (W2). Dump created by SLED; dump object: SLED Figure 16: Information screen in the status window (W2). Dump created by SLED; dump object: BS2000 in the monitor VM |
| INF | Figure 17: Information screen in the status window (W2). Predecessor system; dump object: BS2000 |
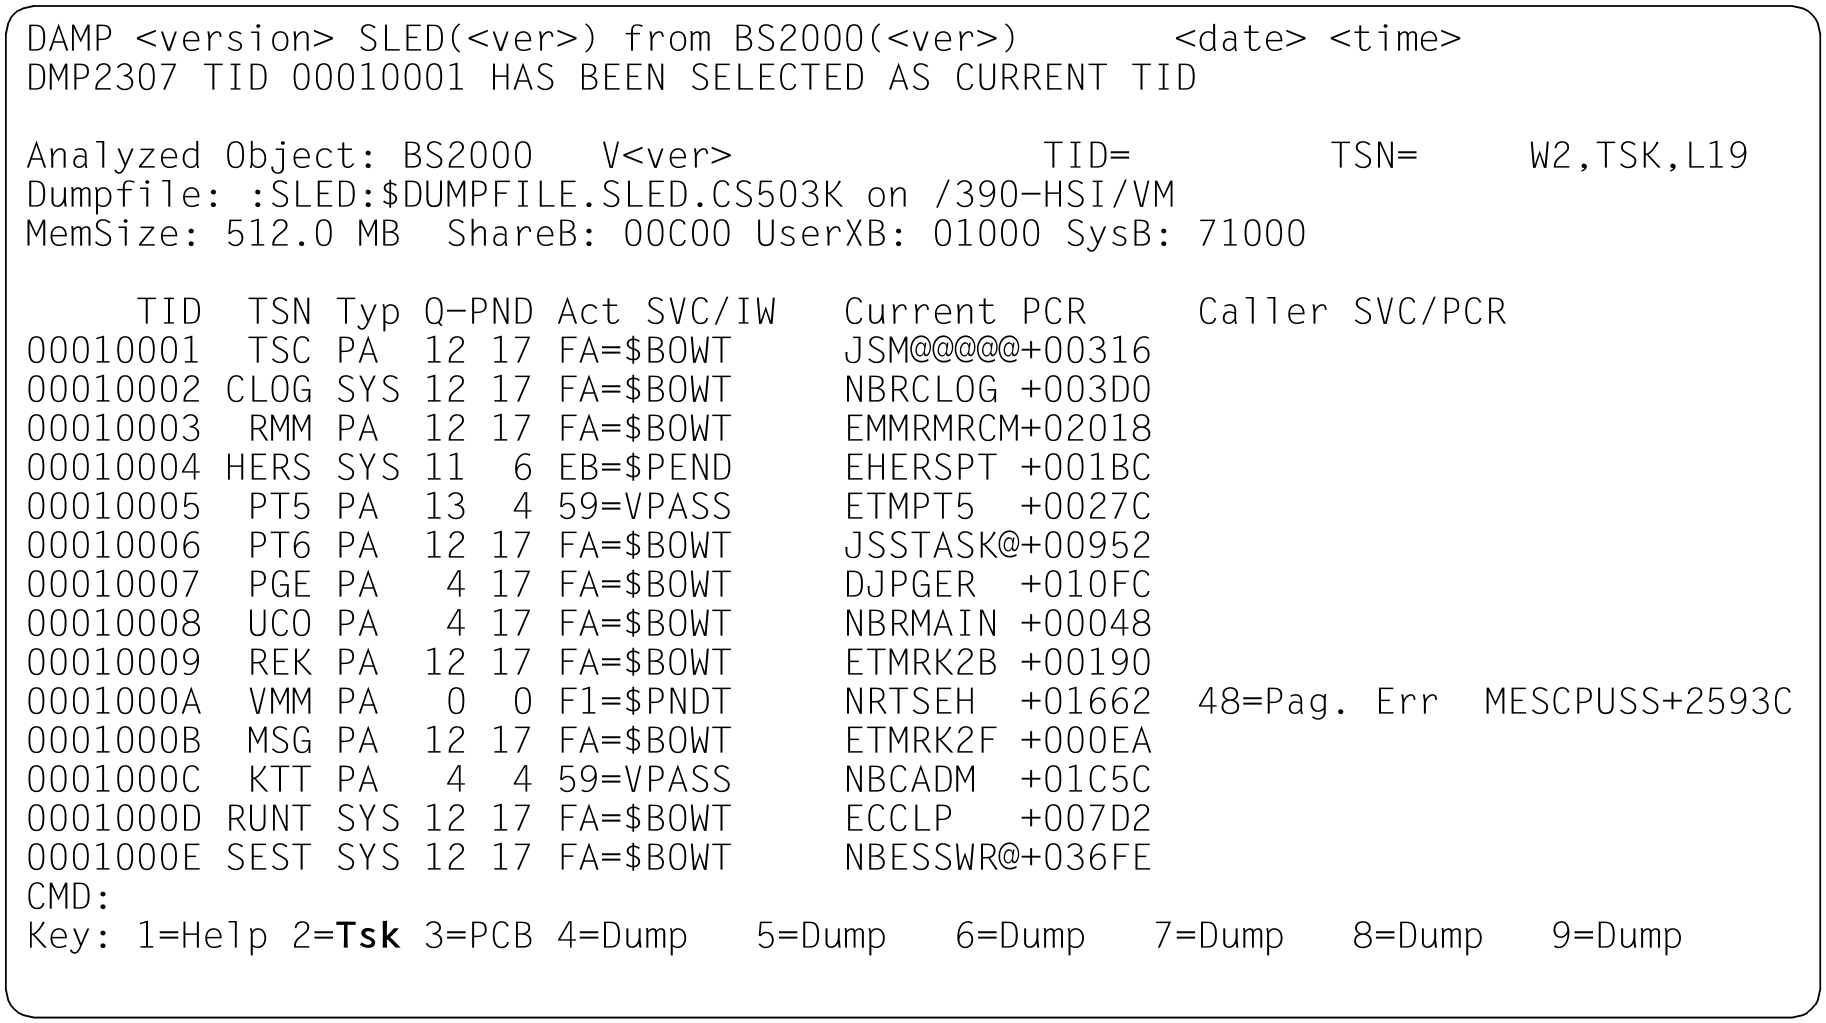
| TSK | This mode is set automatically if a SLED or SNAP with a BS2000 object or the currently active system is to be analyzed and information relating to a number of tasks is available. Only the first 14 tasks are initially shown in the status window (W2). Each line contains the information for one task and can be marked. When diagnosing the active system, the task list is updated only on positioning with “--” to the beginning of the list (i.e. when TID 0001 is displayed). When diagnosing the active system, the termination or creation of tasks can also result in inconsistencies in other windows. If necessary, these have to be updated by bringing the task list up to date. |
| TSK | In the event of a system dump the output of the task list can be set by entering “TSK” in the field mode selection (PLK mode is set by default for the 'error task'). For a system dump the task list also contains all tasks from the BS2000 system to be diagnosed. A task can be selected for further diagnosis by marking a line. CAUTION! The task list can be sorted according to various criteria. To do this you must select a column in the header line. Sorting takes place in ascending order in accordance with the content of the column selected. The default setting is sorting according to TID (1st column). |
Figure 18: Task overview in the status window (W2) | |
| PLK | This mode is set automatically if an area, user or system dump containing only one task is being edited. It can also be set by marking a task line or by entering a TID/TSN in the TSK mode. The right-hand part of the 4-byte TID is sufficient when selecting a task. User PCBs are marked in the output line with an “ The column headed
|
| PLK |
You can return from the first PCB to the task overview with / “-” or by entering Figure 19: PCB overview in the status window (W2), dump file with X86 object |
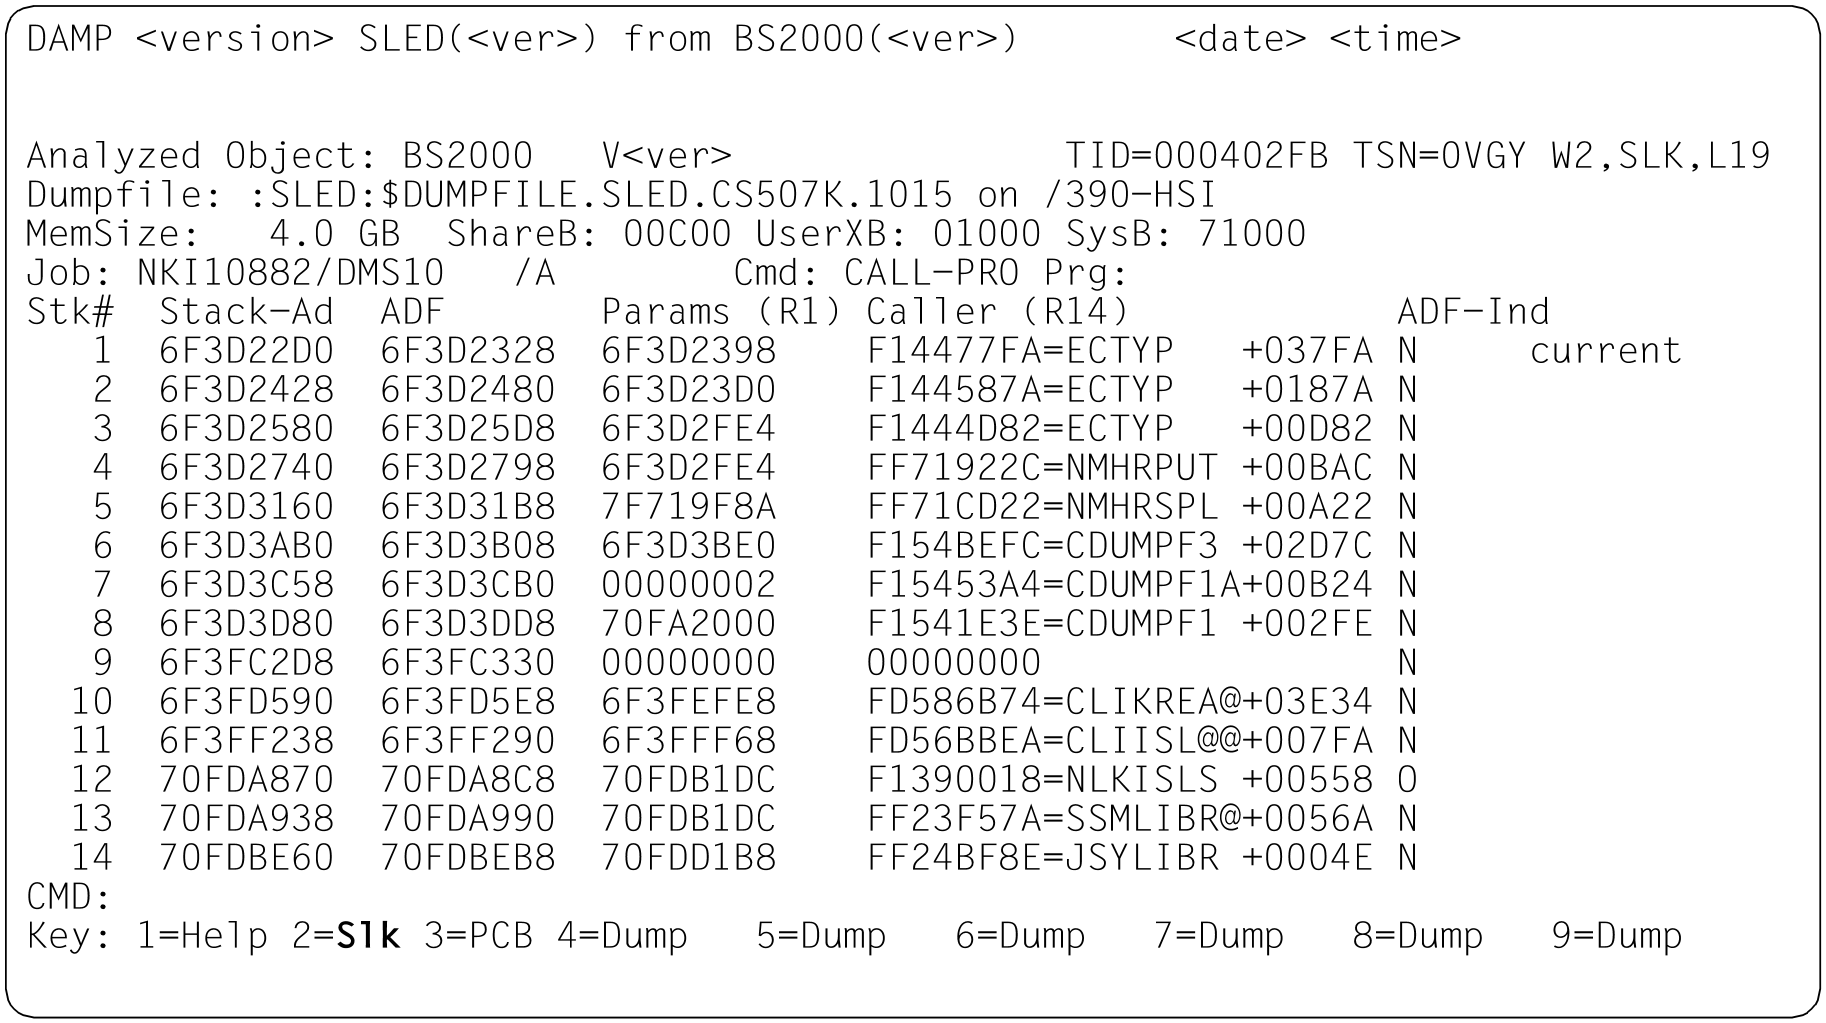
| SLK | In this mode, the call chain is output via the TPR program manager (SPL linkage). To do this, the mode field in the title line of the window must be overwritten with the symbol Figure 20: Chain of program manager calls in the status window (W2) TSK in the “Mode select” field. |
Paging in the status window
You may enter the following: +, -, ++, --, +n, -n or press the function keys (page forward by one window length, which corresponds to +) and (page backward by one window length, which corresponds to -). For further details, see the section on "Paging in a diagnostic window" (Modifying the diagnostic windows).
Note on paging forward
When paging forward (+, ++, +n, ), you stop at the end of the listing involved, and you are not automatically returned to the start of the listing.
Note on paging backward
Pressing the key and entering “-” in the PLK and SLK modes pages back to the task list if the first PCB or first stack is currently visible in the window. Selecting the TSK mode also returns you to the task overview. The current task is then the first task in the overview.
When diagnosing the current system, the task list is regenerated on paging back to the first task in the list with “--” in TSK mode.
If a dump object was selected in dump files with multiple objects, entering or “-” in INF mode cancels the selection.


