Each report has a header containing a name identifying the report, and the associated report group. SM2R1 subdivides the analysis period into small time slots of equal length called analysis subintervals.
The user can control this subdivision by specifying either the number or the length of the analysis subintervals. He can also direct SM2R1 to perform the subdivision. In this case the analysis period is subdivided into as many as 100 subintervals.
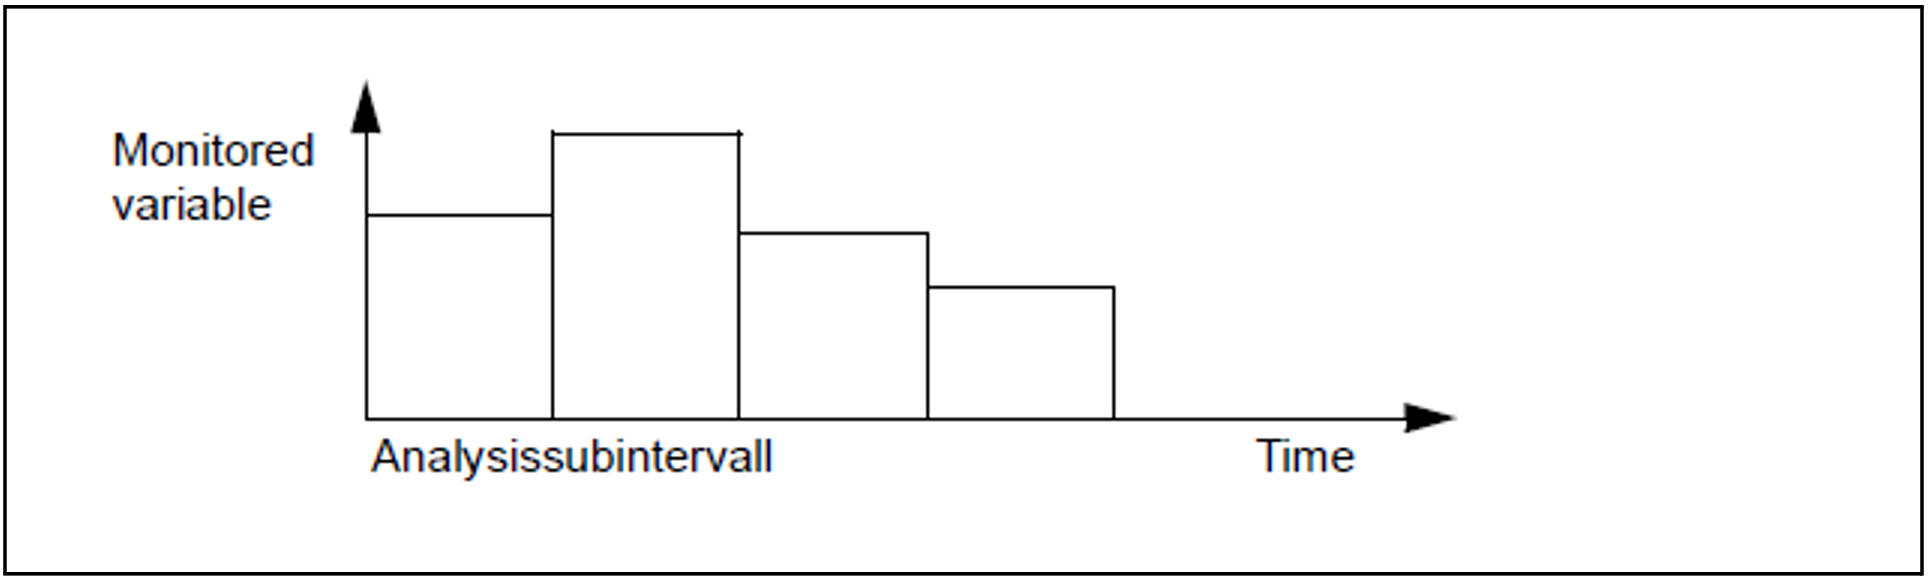
Bar chart
Each analysis subinterval is represented in the bar chart by a bar over the horizontal axis, which itself is divided up into corresponding segments. The vertical axis is the monitoring data scale.
The analysis subinterval is the time represented by one bar.
In the bar chart, SM2R1 outputs the values computed for each analysis subinterval. The computation method is described in the section "Computation of the value of an analysis subinterval".
Division and annotation of the axes
The horizontal axis (abscissa) is the time axis. It is subdivided in analysis subinterval slots and annotated accordingly.
If an analysis subinterval consists of a number of monitoring cycles, the time of the first time stamp record of the analysis subinterval is output as the annotation.
The vertical axis (ordinate) is the monitoring data scale. It is subdivided and annotated appropriately by the analysis routine.
The monitoring data is entered in the bar chart over the horizontal axis in bar form. For each variable, a suitable unique symbol (letter or other character) is used (see section "Table ofvariables reports"). Each symbol is briefly explained in the bar chart legend.
If the ACCUMULATED variables are entered, the totals for the variables are always rounded. This means that the following inaccuracies can arise with very small values:
If, for instance, the rounded value for the first variable is exactly the same as the rounded value for the first two variables, no symbol is output for the second variable.
If the rounded total is greater than the rounded value for the first variable, a symbol is output.
It is nevertheless possible that the value for the second variable is greater in the first of these two cases than in the second.
Entry of variables: ACCUMULATED and NON ACCUMULATED
The specification ACCUMULATED or NON-ACCUMULATED in the header line of the bar chart indicates how the variables are entered in a chart.
ACCUMULATED means that the variables are sequenced, i.e. the bar for one variable begins at the point where the bar for the preceding one ends.
NON ACCUMULATED means that each variable is entered beginning at zero, i.e. the symbols for a small variable overlay the symbols in the lower part of a large variable. If two variables in a chart are the same size, one of them will supersede the other.
|Monitored variable X                 | Monitored variable Y
|***                                  |                     ooo
|******                               |                  oooooo
|*********                            |               ooooooooo
|************                         |            oooooooooooo
|***************                      |         ooooooooooooooo
|******************                   |      oooooooooooooooooo
|*********************                |   ooooooooooooooooooooo
|************************             |oooooooooooooooooooooooo
+---------------------------          +---------------------------
                        Time                                  Time
|   * = Monitored variable X          |   * = Monitored variable X
|   o = Monitored variable Y          |   o = Monitored variable Y
|   accumulated                       |   non-accumulated
|                                     |
|oooooooooooooooooooooooo             |
|***ooooooooooooooooooooo             |***                  ooo
|******oooooooooooooooooo             |******            oooooo
|*********ooooooooooooooo             |*********      ooooooooo
|************oooooooooooo             |************oooooooooooo
|***************ooooooooo             |*********ooo***ooooooooo
|******************oooooo             |******oooooo******oooooo
|*********************ooo             |***ooooooooo*********ooo
|************************             |oooooooooooo************
+---------------------------          +---------------------------
                        Time                                  Time
Representation of averages
In charts using non-accumulated representation, the average of the monitored variables is represented by the appropriate symbol on the right-hand side.
The symbol < represents ' '. As many print columns are used on the right-hand side as are required for unequivocal representation if the symbols overlap.
Variables for which no values can be determined
It is possible that SM2 cannot determine the value of a certain variable in an interval, e.g. because
the variable was not monitored by SM2 or its value was not entered in the SM2 output file for later analysis, or
the variable was monitored but no activity occurred in the interval.
Variables for which no values could be determined in an analysis subinterval are not used for averaging. Blanks appear in the graphical representation instead of a bar.
Subcharts
If the user has specified the size or the number of analysis subintervals with the TIME-STEPS operand of the SET-EVALUATION-PERIOD statement so that more than 100 subintervals (time slots in the bar chart) are required for each analysis period, subcharts have to be output. This is because only 100 time slots can be accommodated on the horizontal axis in the printer listing. SM2R1 does this automatically.
Requesting bar chart output
The user can request bar chart output with the INFORMATION=*DIAGRAMS operand of the PRINT-REPORTS statement.