The analysis period specifies the period for which the SM2 output file is to be analyzed. Individual sections of this time frame are called analysis subintervals. When time series are output, an analysis subinterval is represented as a bar.
Computation of the value of an analysis subinterval
The monitoring cycle records are used to compute the monitored variables for one subinterval.
SM2R1 uses only those records for each requested variable that contain the required monitoring data.
From this monitoring data SM2R1 computes the value of an analysis subinterval using the following formula:
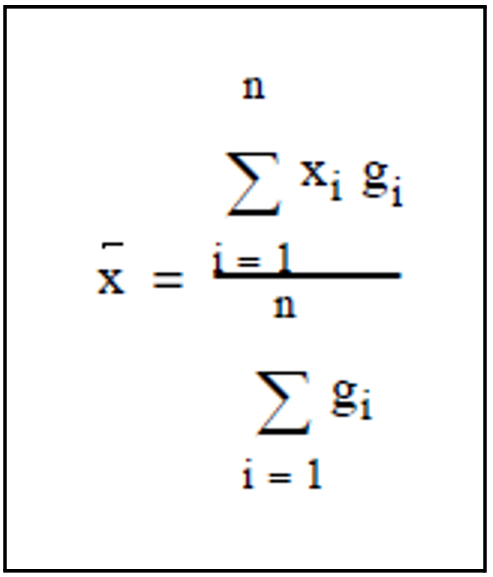
where:
x: mean value for an analysis subinterval
xi: single monitored value
gi: weighting
n: number of monitored values
Depending on the meaning of the individual monitored data, a weighting on the basis of the length of the monitoring cycle or a different monitoring variable is performed. For example, the monitored data for the duration of an input/output may be weighted using the number of inputs/outputs.
The computed value is entered in the bar chart as the value for one analysis subinterval.
SM2R1 processes the data of those monitoring cycles whose time stamp record falls within the relevant analysis subinterval.
Computation of statistical data
For each monitored variable, SM2R1 can output a table with statistical data instead of a bar chart. The data covers the whole analysis period. If it is output in addition to a bar chart, it refers to one bar chart page.
The analysis subinterval data computed beforehand is used for the computation.
Average
The average value of the analysis period is calculated in a way similar to the values for the analysis subintervals.
Minimum
Minimum of the averages of the various analysis subintervals:
min (x)
where: x average for an individual analysis subinterval (see above)
Maximum
Maximum of the averages of the various analysis subintervals:
max (x)
where: x average for an individual analysis subinterval
Standard deviation
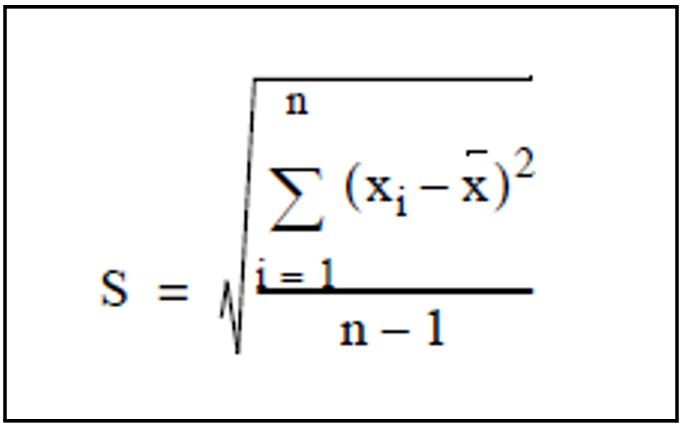
where:
x: average value of the analysis period
xi: value of an analysis subinterval
n: number of analysis subintervals