Application area: SCSI interface (some parameters have no effect) and ABBA interface
The LIST menu is used to branch to a menu from which you can view, evaluate, print or delete the trace files of the ROBAR-SV instance selected in the INSTANCES menu.
The trace files log all ROBAR-SV instance actions, see "Trace files of the ROBAR-SV instances".
The menu also gives you access to the information on all the archive numbers permitted for the ROBAR system in the archive record (contents of the ROBAR_ARCHIV configuration parameter - see "Sample of the interface-specific configuration file (ABBA interface)" and "Sample of the interface-specific configuration file (SCSI interface)").
LIST provides the following functions:
DELETE
Delete trace files.
You must delete trace files regularly to avoid saturation of the disk memory.
Once the ROBAR processes have started, you may only delete the trace files which are suffixed with a time stamp. The current trace files (see "Trace files of the ROBAR-SV instances") cannot be deleted until the ROBAR processes have stopped running.
The names of all existing trace files are displayed.
When you have entered the file name and it has been checked, the specified trace file is deleted. This is logged in the last line.
If you hit [ENTER] instead of entering the file name, nothing is deleted and you are returned to the LIST menu.
EDIT
Edit trace files.
The names of all existing trace files are displayed.
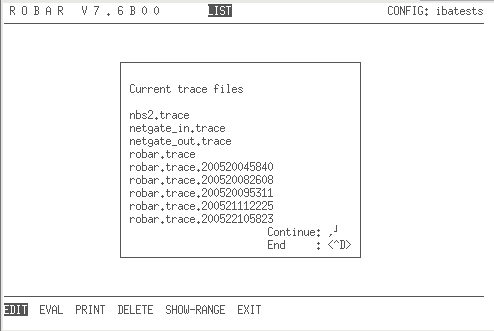
Figure 13: List of trace files
When you have entered the file name and it has been checked, the specified trace file is displayed.
In the trace file you can
scroll forward and backward
position the cursor
search for a particular text
log the screen outputs
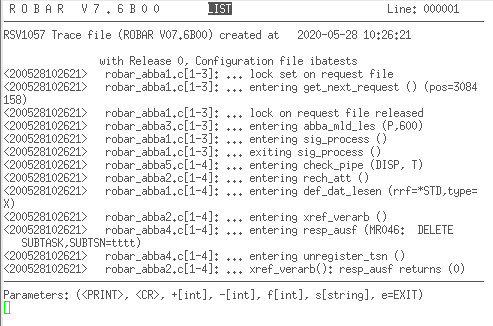
Figure 14: Evaluating the trace files
You can control the evaluation with the following entries:
| log the screen outputs |
| page forward one screen |
| page forward one screen |
page backward one screen | |
| position cursor at start of file |
| scroll forward |
| position cursor in line |
| search forward for |
| search for the last entered [string] ; you can specify the search direction using the arrow keys (instead of |
| return to the |
EVAL
Evaluate trace files for a specifiable period, i.e. compile statistics.
The names of the existing trace files are displayed.
You are asked to enter the following:
File name or
[ENTER]:
Enter the name of the trace file to be evaluated. If you just hit[ENTER]instead of entering the first file name, you are returned to theLISTmenu.This message continues to appear until you hit[ENTER]instead of entering the file name. You can enter up to 10 trace files.Enter the evaluation period or hit
[ENTER]:
Specify the evaluation period in the formatyymmddhhmmss-yymmddhhmmss. The system will then evaluate all trace entries made within this period. If you just hit[ENTER]instead of entering an evaluation period, all trace entries are evaluated.The syntax of the time details is checked (date and time). A check is also performed as to whether the start and end times are logical.Select the statistics
After specifying the trace file and the desired period, the statistics below can be compiled using the listed parameters:Summary statistics
SUMparameterHost statistics
HOSTparameterStatistics on manual inputs
MANparameterCleaning statistics
CLEANparameterIMPORT/EXPORT statistics
IMP/EXPparametersInventory statistics
INVparameterError statistics
ERRORparameter
The statistics and their report lists are described on "ROBAR statistics".The statistics are compiled once you have selected the appropriate parameter. You can then select the next type of statistics.
Displaying the statistics The
SHOWparameter displays the created statistics on the screen using an editor.Print the statistics
You can print statistics that have been created on the default printer using thePRINTparameter.
EXIT
Return to the main menu.
Print statistics created using EVAL for a specified period.
The names of all existing trace files are displayed.
When you have specified the desired trace file, you will be asked whether the entire file is to be printed or only an excerpt covering a certain period. You must enter this evaluation period in the format yymmddhhmmss-yymmddhhmmss or only with [ENTER]. If you just hit [ENTER], all trace entries are printed, otherwise only the entries made during the specified period.
The selected trace file is printed on the default printer.
In the trace file to be printed, any entries beyond column 80 are continued in the next line.
If you hit [ENTER] instead of entering the file name, nothing is printed and you are returned to the LIST menu.
SHOW-RANGE
Output information on the contents of the configuration parameter ROBAR_ARCHIV (see section "ROBAR_ARCHIV configuration parameter" in chapter "Sample of the interface-specific configuration file (SCSI interface)").