The Dashboard menu contains the Dashboard tab, which provides a quick overview of the Systems, Units, IP networks, FC networks, Storage, Cluster, Users and Events of the SE server configuration. The Dashboard is displayed after you have logged in on the SE Manager.
If at least one AU PQ is available, Units/Partitions is displayed instead of Units. With AU PQ, the chassis of the AU and the partitions are each counted as individual units.
Cluster is displayed only if at least one cluster exists in the SE server configuration.
Up to 3 status classes are displayed per object type. If more than 3 status classes are currently assigned, the last line displays the status class with the highest priority level. The totals display also contains the less urgent problematical statuses which cannot be displayed separately.
The tab offers the following functionality for this purpose:
Detailed information on the Dashboard tab is provided in the SE Manager help.
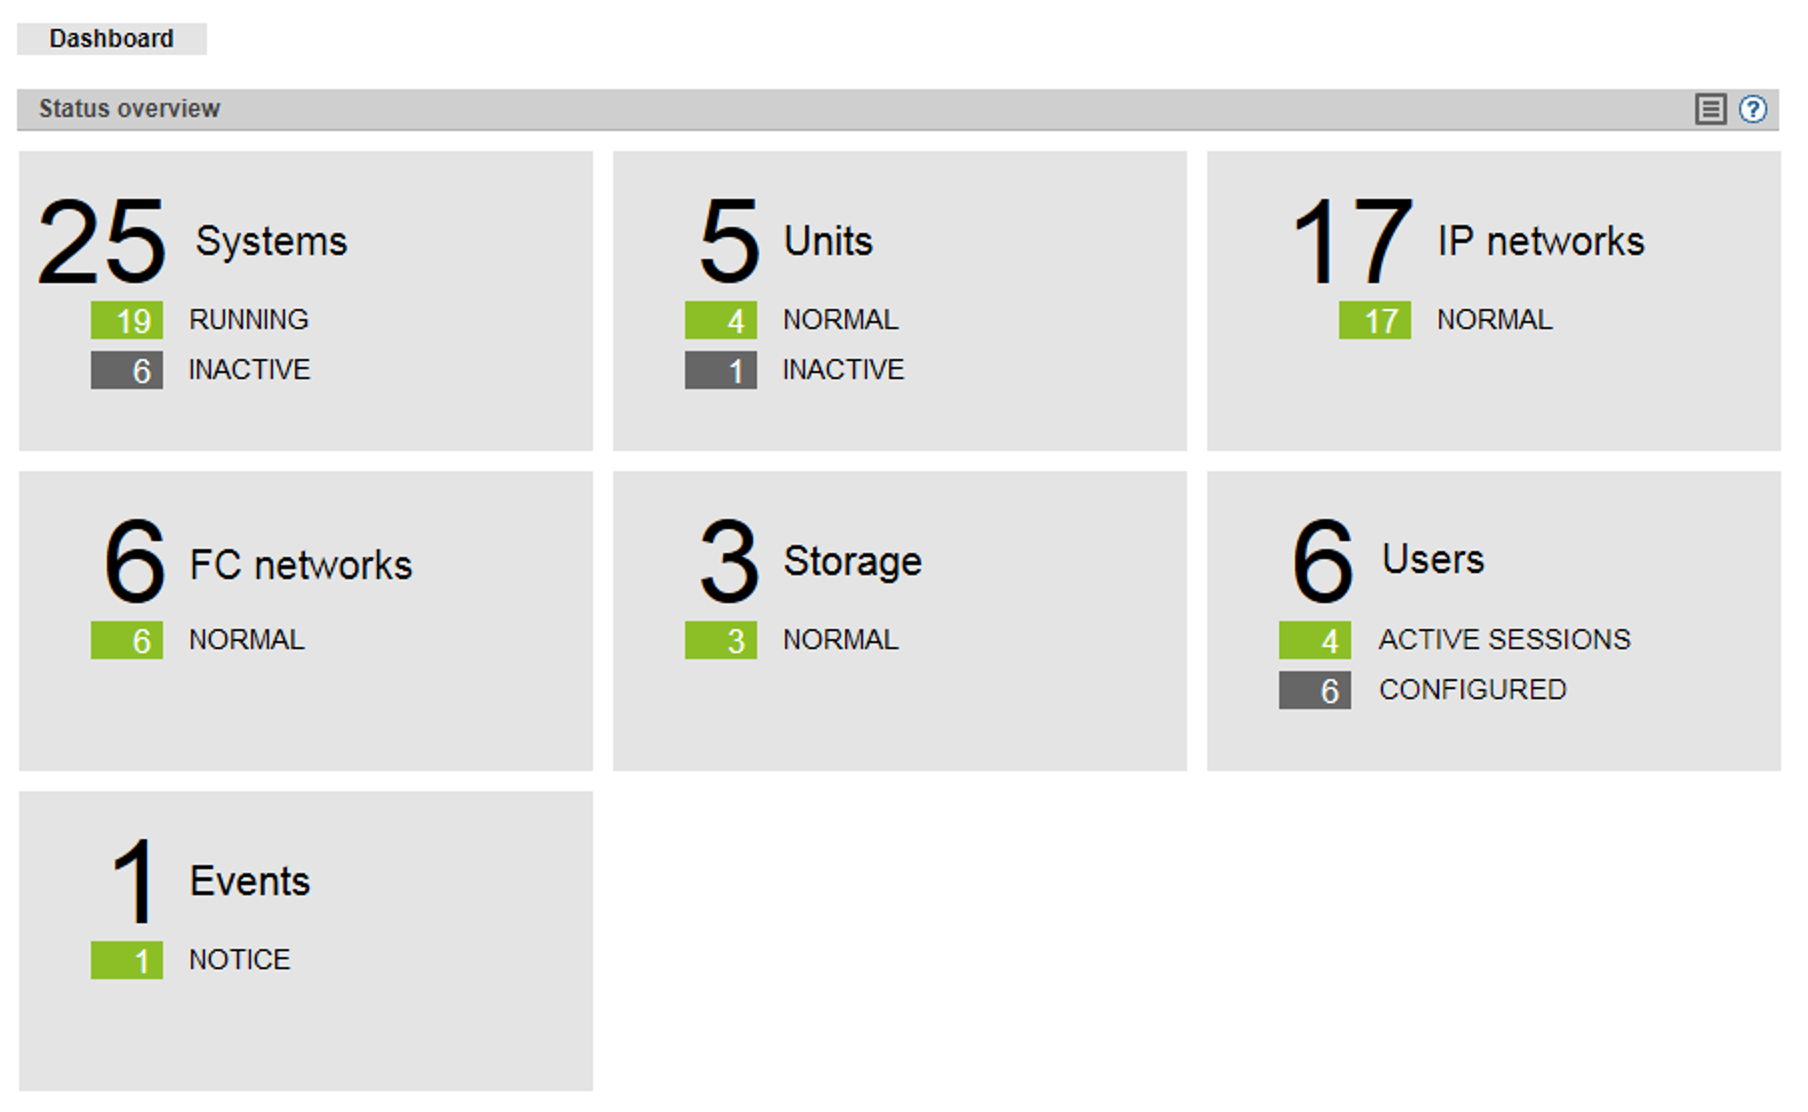
Displaying the status overview in the tile view
> | In the tree structure select Dashboard. The Dashboard tab with the Status overview group opens. This enables you to see at a glance whether any problem exists. |
> | If the tile view is not displayed, click the Tiles icon in the group header. |
The tile view opens.
Displaying the status overview in the list view
> | In the tree structure select Dashboard. The Dashboard tab with the Status overview group opens. This enables you to see at a glance whether any problem exists. |
> | If the list view is not displayed, click the List icon in the group header. |
The list view opens.
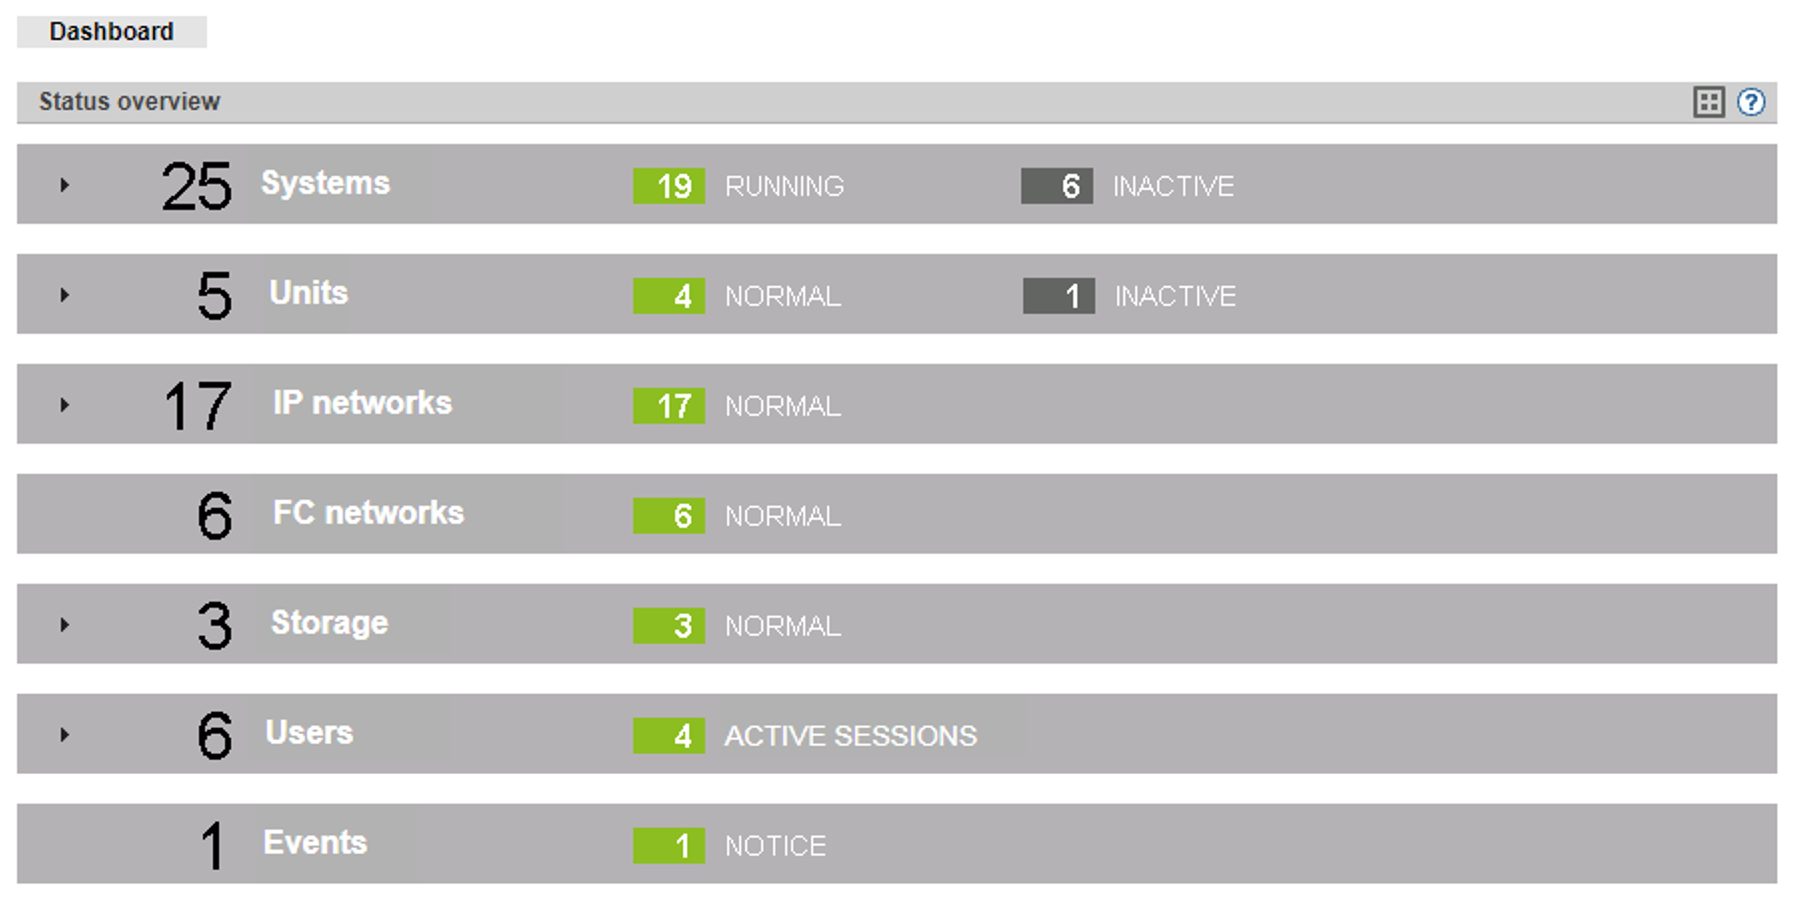
> | Click the arrow at the start of a component row. The list for the selected component expands. In the expanded status the information is subdivided further, and displayed in a line for each object type. |
Displaying the overview page associated with a component
> | In the tree structure select Dashboard. |
> | When the Dashboard tab in the tile view opens, click the tile for the required component, e.g. Systems. |
> | When the Dashboard tab opens in the list view, click the component name in the list header of the required component, e.g. Systems. |
The corresponding overview page opens, in this case the Systems main menu with the Overview tab.
Filtering the overview page according to an object type
> | In the tree structure select Dashboard. |
> | If the list view is not displayed, click the List icon in the group header. |
> | Click the arrow at the start of a component row to which the required object belongs, e.g. Units. The list for the selected component expands. |
> | In the expanded list, click the required object type, e.g. Management Unit. |
The associated overview page opens with the corresponding filter, in this example the Hardware main menu with the Units tab. Only Management Units are displayed.
Displaying the overview for a component / object type filtered according to status
Up to 3 status classes are displayed. If more than 3 status classes are currently assigned, the last line displays the status class with the highest priority level. The totals display also
contains the less urgent problematical statuses which cannot be displayed separately.
> | In the tree structure select Dashboard. | ||||
> | If the list view is not displayed, click the List icon in the group header. | ||||
> | Select one of the following procedures:
|