The Event Logging function displays the logged events in the Current events and All events tab.
The dashboard of the SE Manager contains the Events tile, on which the number of currently pending events is displayed, depending on their weights (NOTICE, WARNING, ERROR etc.). The tile is linked to the Current events tab of the Event logging.
Current events
> | Select Logging 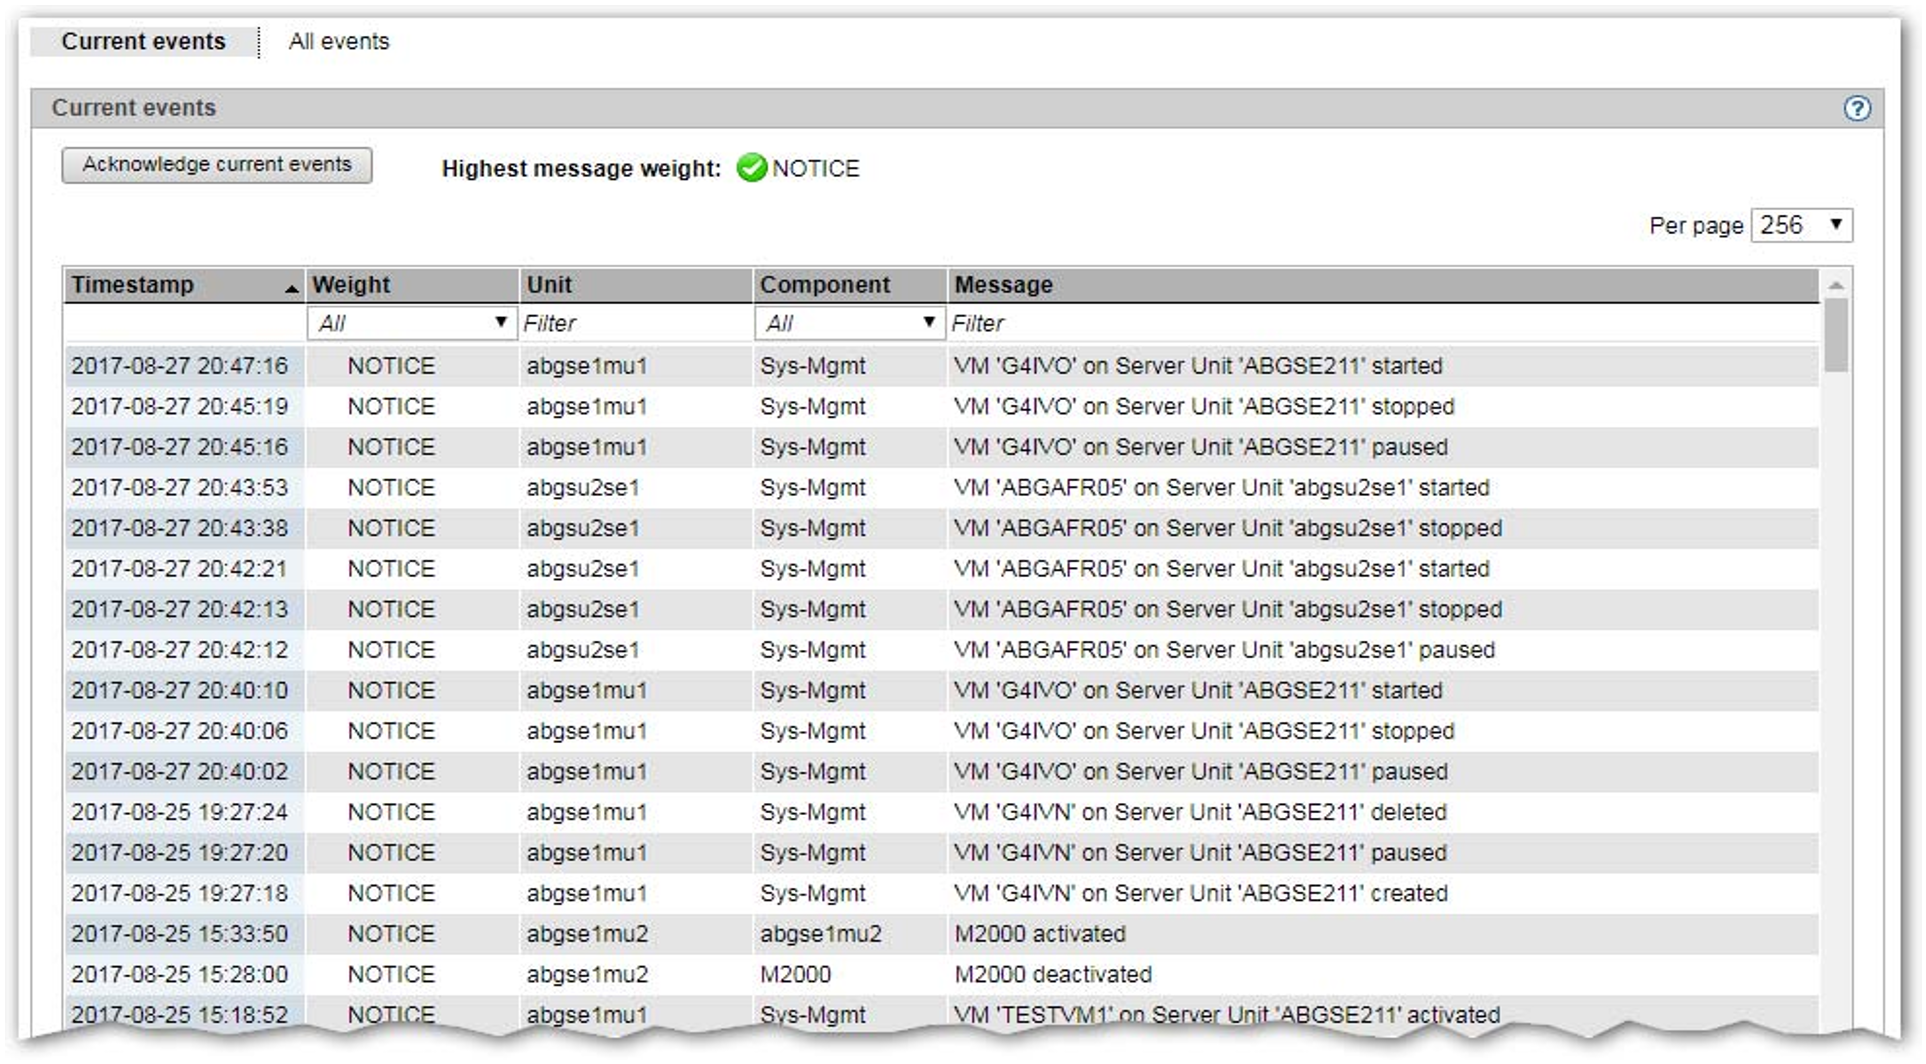 The Current events tab contains a list of all events that have occurred since the last time you acknowledged events. You can only acknowledge the whole table: | |
> | Click on the Acknowledge current events tab and confirm the action. | |
All currently displayed events are removed from the table and are now only visible in the All events tab. | ||
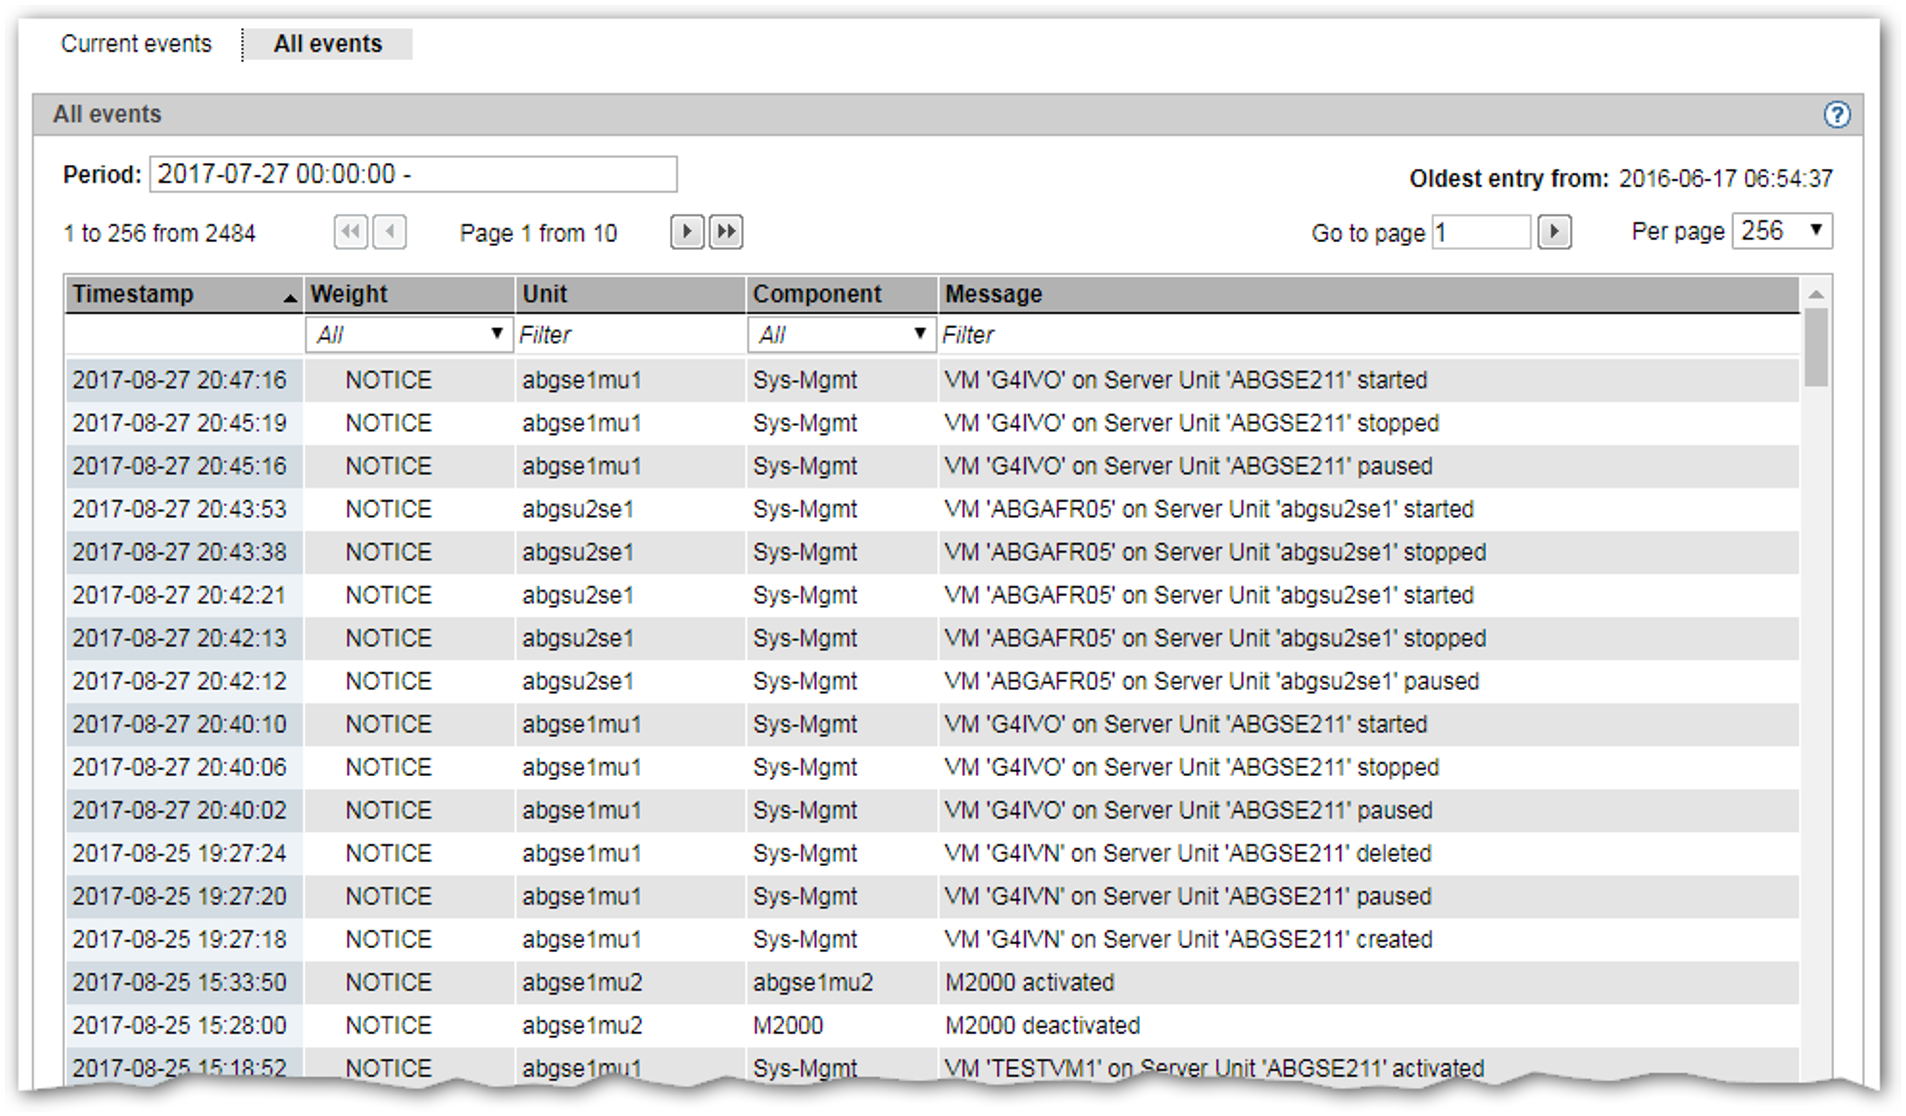
All events
> | Select Logging In this group, all occurred events are listed. |
Default sorting and scope of the listed results
In both tabs, the default sorting is by the time stamp of the events, with the newest event listed first.
In the All Events tab you can use the Period: field to filter for entries from a certain time.
To ensure that the time stamps are consistent, it is required that all units (MU, SU x86, HNC etc.) are synchronized with an NTP server.
See also section "NTP server".
To restrict the number of displayed results, you can filter by the following criteria:
Weight of the event (e.g. >=WARNING, >=ERROR, >=CRITICAL)
Name of the unit on which the message was issued
Component that issued the warning (e.g. M2000, X2000, Sys-Mgmt, cluster or name of an installed add-on)
Message text
The currently possible events with messages are listed in the online help of the SE Manager under "Further information".