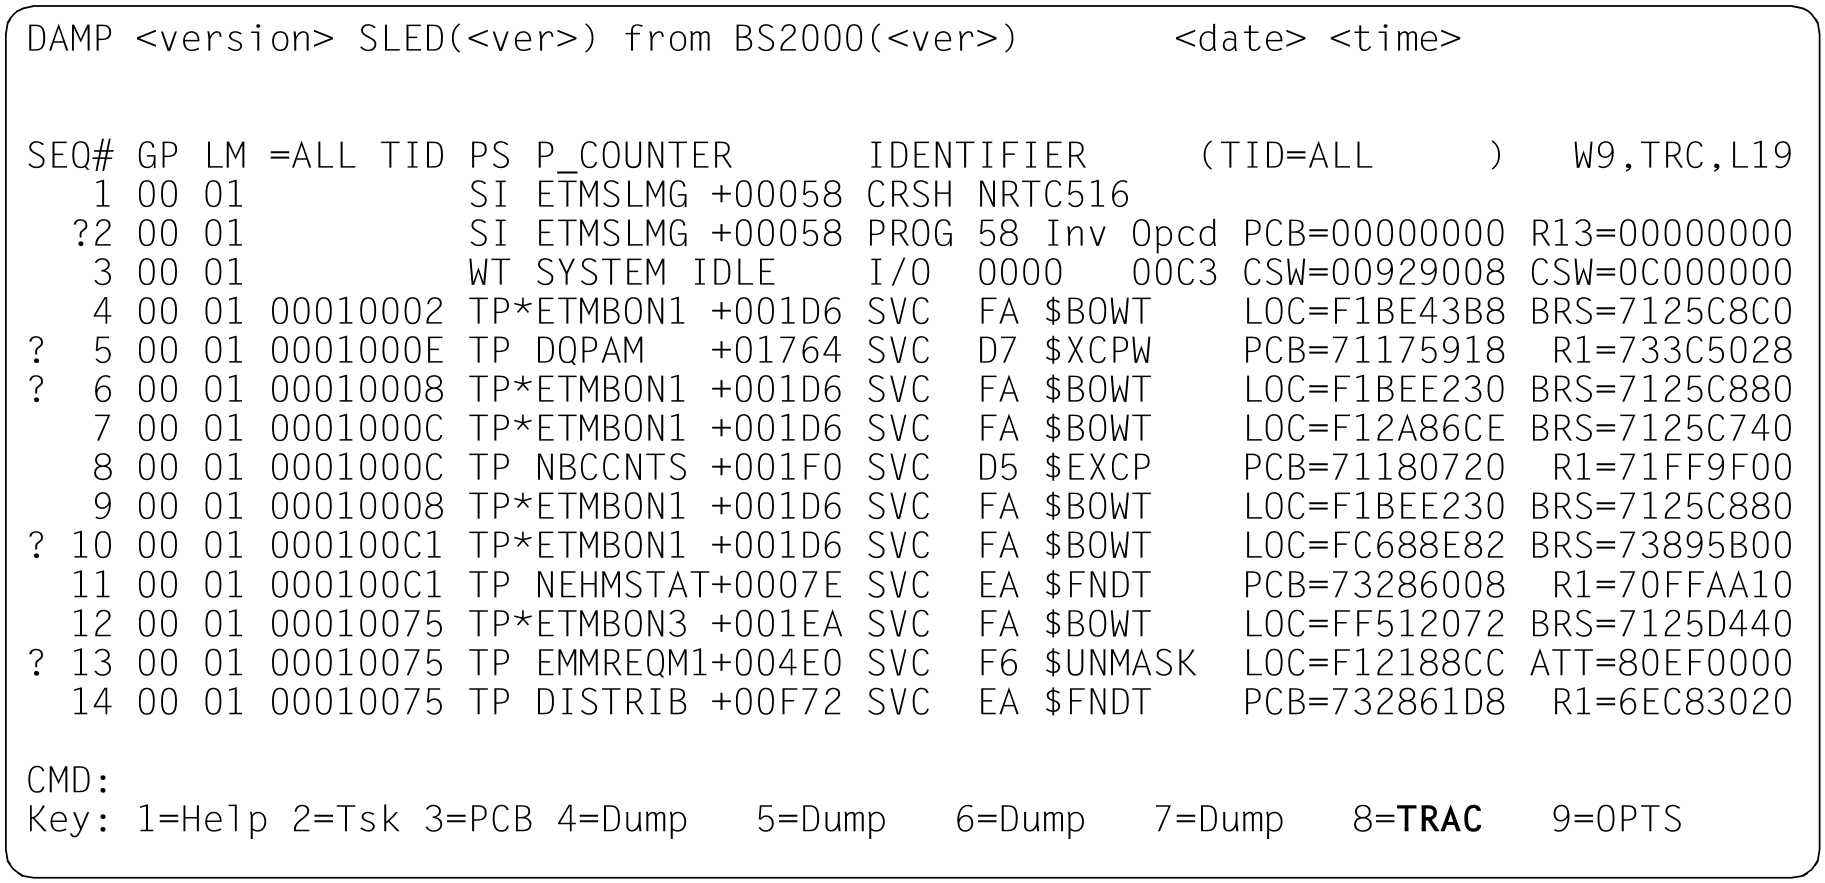
The SHOW-EDITED-INFORMATION statement allows you to output the system trace table in edited format in a specific window.
SHOW-EDITED-INFORMATION INFORMATION=*TRACE-TABLE-EDIT, WINDOW=<w>
Following the call, the trace table entries of all tasks contained in the diagnosis object are displayed. The contents of the “Task select” input field can be changed to a <tid> or to ALL.The number of a logical machine or the value ALL can be entered in the “LM” field.
Figure 40: Output format of the system trace table
Besides selecting a task, you can also modify the length of a window and page within a window. See “Paging in a diagnostic window” (Modifying the diagnostic windows) for more details.
The entries in “SEQ#” as well as all the fields that contain the addresses can be marked. You mark the address of a system trace table entry with the sequence number. This is useful if you want to look at an entire entry.
The CPU number and the logical machine number are shown in the GP and the LM column of the trace list.
By default, DAMP sorts the trace entries chronologically on the basis of the time stamp, which is also recorded. If required, however, output can be specified for a specific logical machine. This is done by entering a number in the LM field in the header line. Note that it is not possible to select a task at the same time as a logical machine and vice versa.

